Mapper Use-Cases at Ayasdi
Ayasdi developed commercial Mapper software and sells a subscription service to clients who wish to create topological network visualizations of their data.
This post is part of the series The Data Scientist's Guide to Topological Data Analysis.
Want to get notified about new posts? Join the mailing list and follow on X/Twitter.
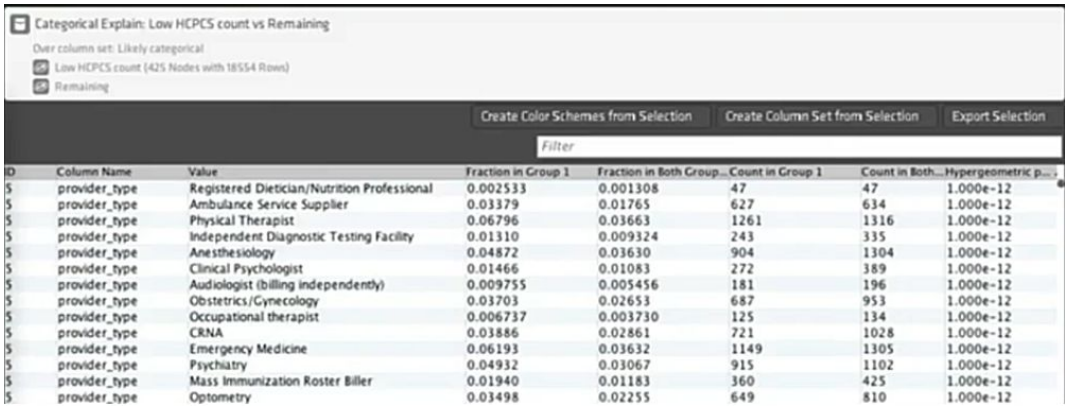
The commercial company Ayasdi developed commercial Mapper software and sells a subscription service to clients who wish to create topological network visualizations of their data. Their implementation is similar to R’s TDAmapper, except that it is heavily optimized to crunch large-scale datasets consisting in the millions of records. Furthermore, it has an “explain” function which automates the process of differentiating clusters via statistical testing. “Explain” works by running a barrage of statistical tests against a selected group, and ranking the selected group’s most significant differences from the rest of the data.
In this section, we explore several commercial use-cases of Ayasdi’s software. Many of the use-cases involve coloring the nodes of the network, visually identifying clusters, and figuring out what separates interesting clusters from the rest of the data.
Forecasting Returns
Below is a network that Ayasdi software generated by applying the Mapper algorithm to over 300 market and economic variables, sampled over 25 years (Roche et al. 2015). The nodes are colored by year.
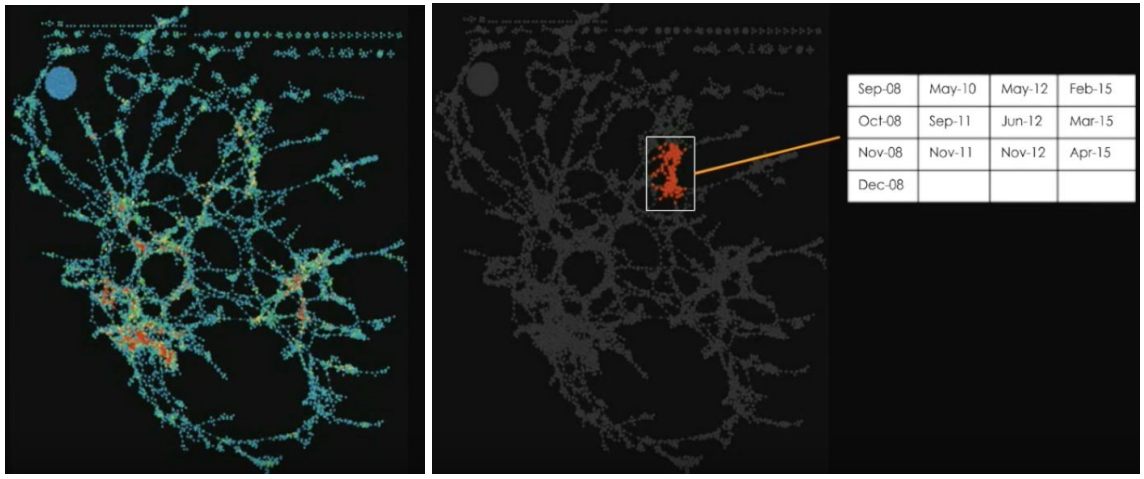
We see that the map is spread out over time, which indicates repeated patterns over time. For example, the group of highlighted nodes corresponds to high-volatility and high-stress conditions. This suggests the following strategy to forecast from an initial date: locate neighboring dates on the map, use their price trajectories to build a distribution of changes in price for each asset, and use mean or median for predictions. Then, individual predicted asset price-changes can be aggregated to yield higher-level predictions, i.e. for each market sector.
Diagnosing Denied Claims
Simple denial patterns, consisting of only a few patterns, usually account for only a small portion of a denial backlog. However, Ayasdi’s software has been used to find complex patterns in infusion and oncology medical necessity denials, accounting for up to 65% of the denial backlog (“Machine Intelligence,” 2015). The following topological network was constructed by applying the Mapper algorithm to 5 million individual claims - its structure is determined by similarity between claims, and its nodes are colored according to how often the claims were accepted or denied on average.
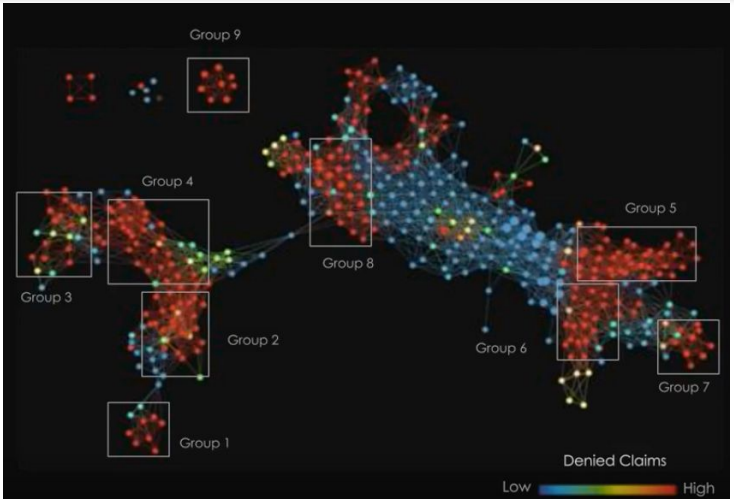
By locating several groups in the network and analyzing the group statistics, analysts were able to gain enough information to advise action pre-submission by modifying the final coding or supporting diagnosis, or at the point of care by seeking pre-authorization or reconsidering a procedure.
Detecting Fraud
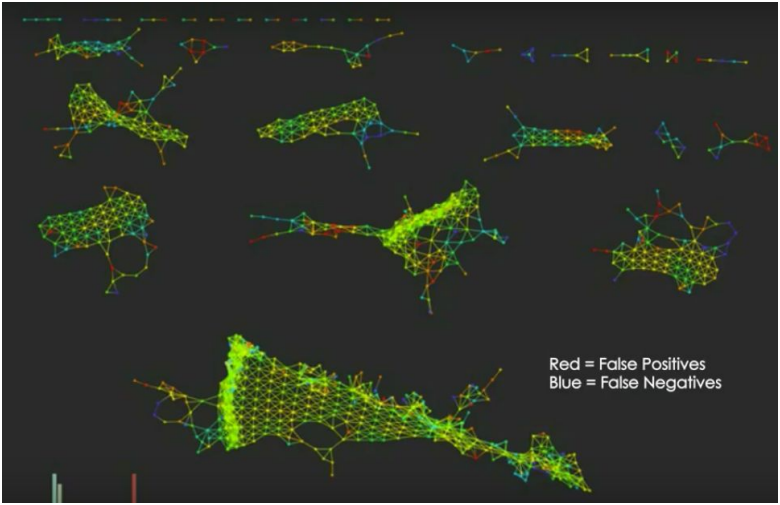
The topological network below is based on the CMS public health claims dataset, which consists of over 9 million claims, 36 thousand providers, and 3600 unique codes (Rogers and Grahnen, 2015). The network structure is determined by similarity in how providers practice, while the node color is determined by medicare payment amount.
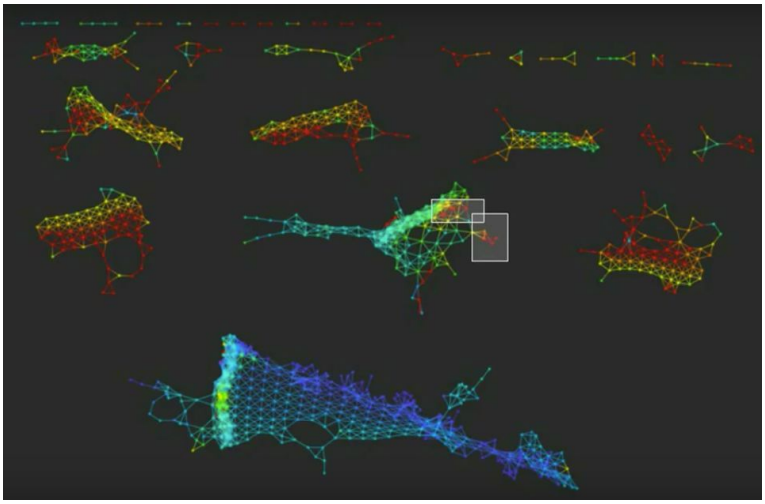
One can identify leads for investigation by looking for outlier providers who are getting paid abnormally much compared to other similar providers (two such groups are boxed in the network above). One can also improve detection models using this topological network: by recoloring the network nodes according to model performance (e.g. false positive rate), one can find groups for which the model performs poorly - and by running statistical tests to discover how these groups differ most significantly from the rest of the population, one can identify specific parameters that the model may have learned incorrectly.
Oil and Gas Exploration
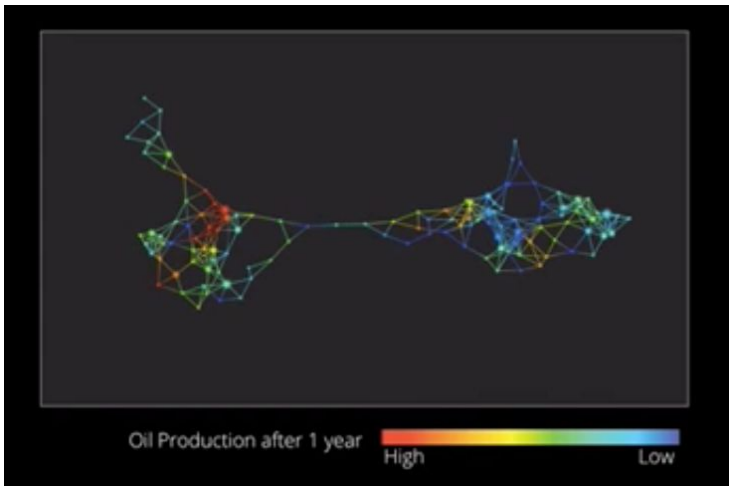
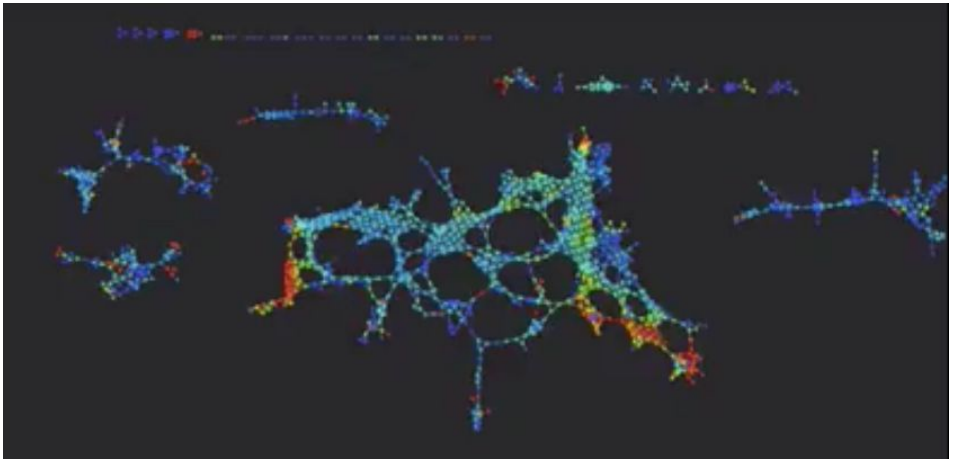
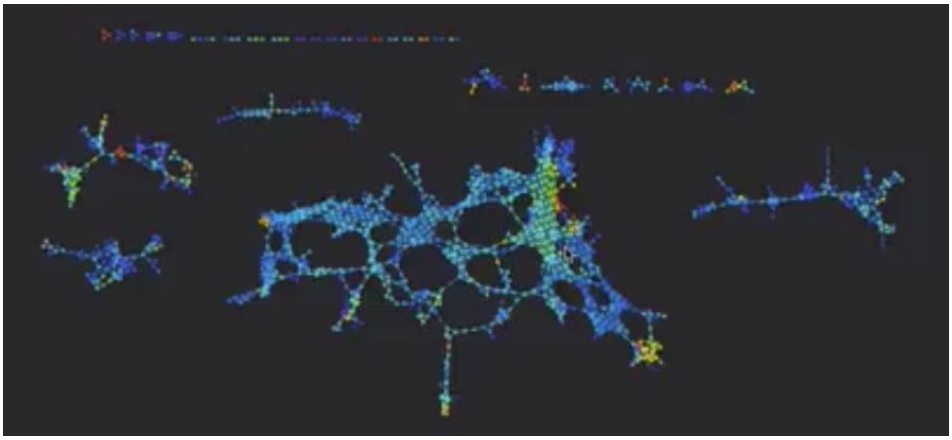
Below is an example of a topological network whose structure is based on drilling location, and whose color is based on the amount of oil recovered there (Parulekar and Johnson, “Analyzing Oil,” 2014). This information can be useful in identifying new locations most likely to be oil-rich.
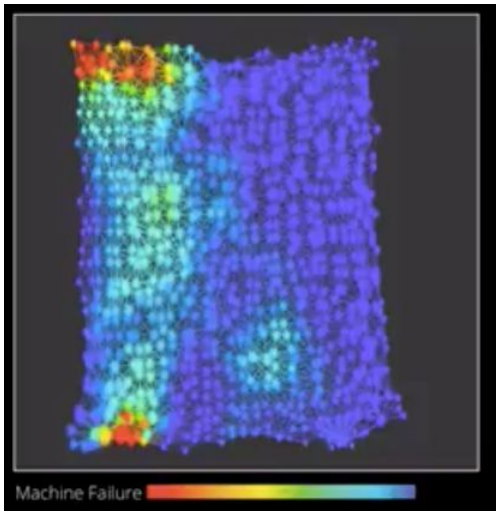
Topological networks can provide valuable information about the drilling equipment, as well. Below is a network whose structure is determined by a number of system state readout variables, and whose color determined by frequency of failure (red = high, blue = low). By better understanding the correlation between system status and failure frequency, one can anticipate critical events and avoid unnecessary replacements.
Campaign Ad Targeting
Based on data on 37,000 Twitter users who tweeted about Chris Christie, a topological network structured by account similarity and colored by word frequency can be used to identify niche conversations that are good targets for campaign ads (Parulekar and Johnson, “Campaign Planning,” 2014). Shown below (top to bottom) are colorings corresponding to “scandal,” “traffic,” and “Governor.”
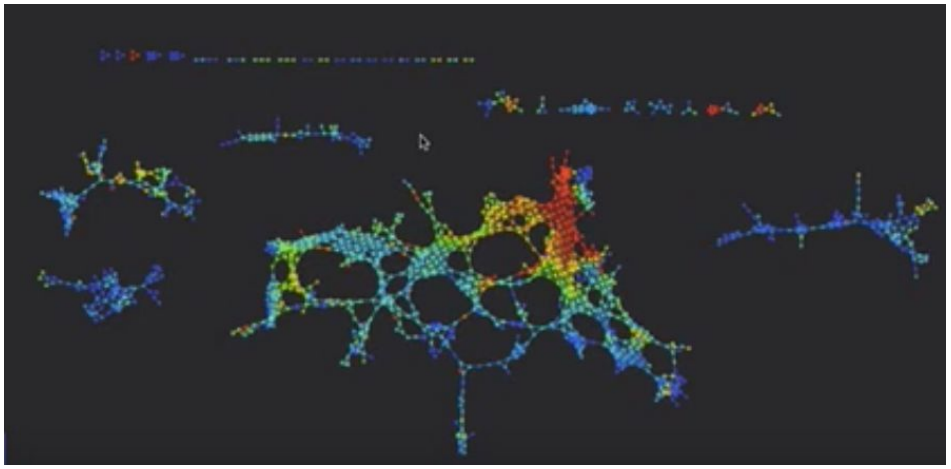
One can also investigate an individual group to see what other words differentiate the group from other groups. This gives more specific insight into the content of the discussion.
Biomarker Discovery
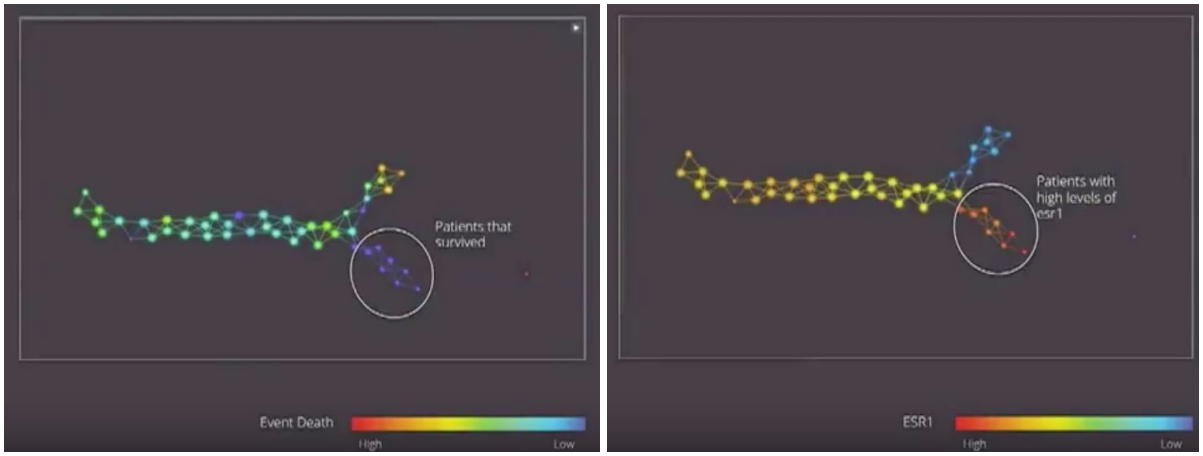
Below is a topological network generated by data from 272 breast cancer patients, where the structure is based on similarity in genes expressed by patients (Parulekar and Johnson, “Ayasdi Cure,” 2014). The left graph is colored by death (red = high, blue = low), while the right graph is colored by esr1 level (red = high, blue = low). We can see that the flare of patients who survived corresponds to the flare of patients with high levels of esr1.
References
- "Machine Intelligence for Denials Reduction." Ayasdi Resources. 2015.
- Parulekar, Sanjna, and Alexis Johnson. "Analyzing Oil & Gas Data with Ayasdi." Ayasdi Resources. 2014.
- Parulekar, Sanjna, and Alexis Johnson. "Ayasdi Cure: Turning Data into Therapies" Ayasdi Resources. 2014.
- Parulekar, Sanjna, and Alexis Johnson. "Campaign Planning with Social Media Intelligence." Ayasdi Resources. 2014
- Roche, Terry, Tim Grant, Patrick Rogers, and Mukund Ramachandran. "Predicting the Future: Forecasting Returns using Machine Intelligence." Ayasdi Resources. 2015.
- Rogers, Patrick, and Johan Grahnen. "Recognizing the Shape of Fraud: Improve FWA discovery with Machine Intelligence." Ayasdi Resources. 2015
This post is part of the series The Data Scientist's Guide to Topological Data Analysis.
Want to get notified about new posts? Join the mailing list and follow on X/Twitter.