Mapper Use-Cases at Aunalytics
At Aunalytics, Mapper outperformed hierarchical clustering in providing granular insights.
This post is part of the series The Data Scientist's Guide to Topological Data Analysis.
Want to get notified about new posts? Join the mailing list and follow on X/Twitter.
Aunalytics is the data science software & consulting company at which the author is employed (at the time of writing). Here, Mapper (via R’s TDAmapper) outperformed hierarchical clustering in providing granular insights on a location tracking dataset, and detected call-center teams that took abnormally long times to accept calls even when there was little cohesion in the network.
Segmentation via Location Tracking
A location tracking dataset from an Aunalytics digital media client included a count of visits to different location categories. In attempt to segment the user base, the author originally performed hierarchical clustering on visit profiles within each category. The highest degree of segmentation was observed within the “Recreation and Leisure” category, which consisted of the following subcategories: Stadiums/Arenas, Recreation Centers, Swimming Pool, Athletic Fields, Baseball, Basketball, Football, Soccer, Tennis, Running, Golf, Gym and Fitness Centers, Outdoors.
To perform hierarchical clustering, the author created a dataset whose rows consisted of visit frequency (in %) for each of 13 subcategories above, and then computed and sorted a Euclidean distance matrix via dendrogram. The resulting visualization revealed 6 clusters.
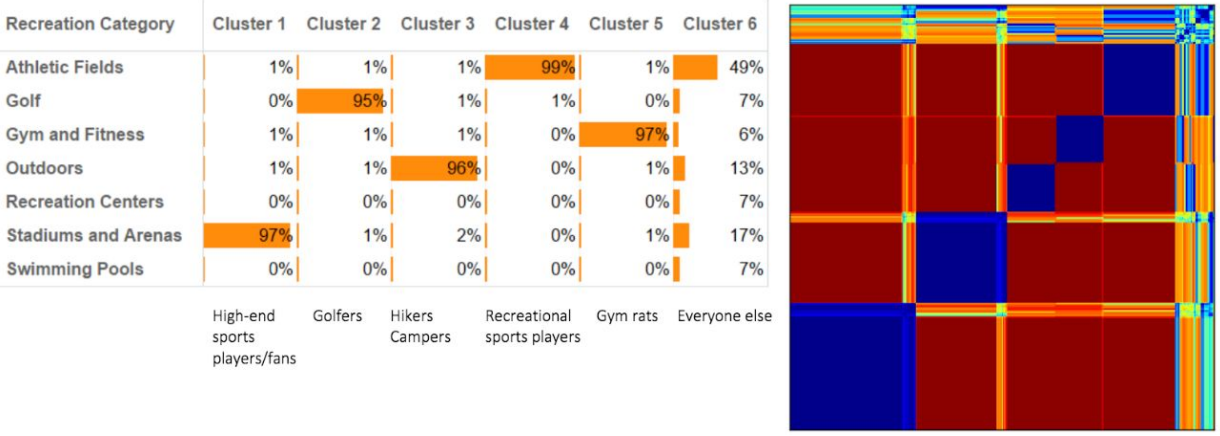
Using the Mapper algorithm, however, revealed many more clusters. Moreover, it revealed paths by which clusters were connected.
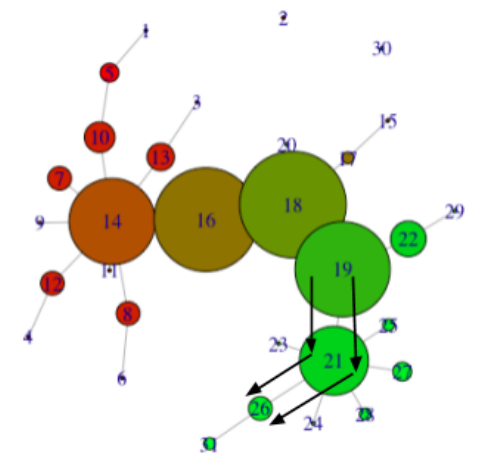
For example, we will inspect the distinguishing characteristics of the high-visit flare consisting of nodes 19, 21, and 26. Below are graphs of column means for the in-node and out-of-node populations.
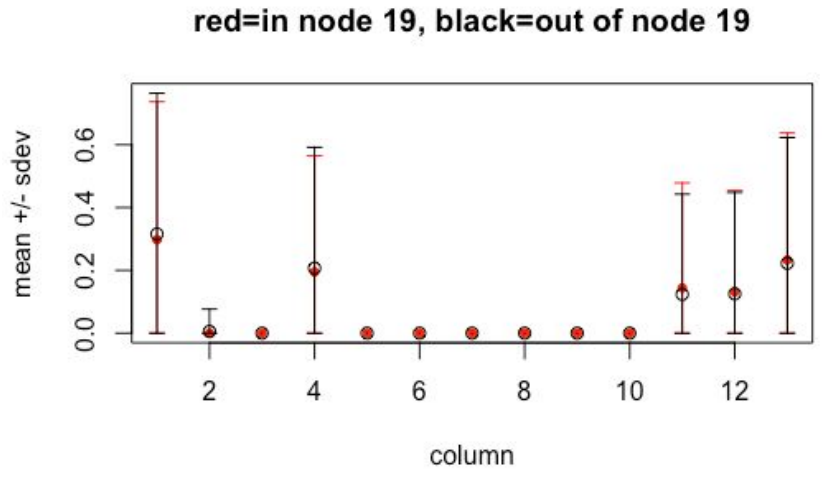
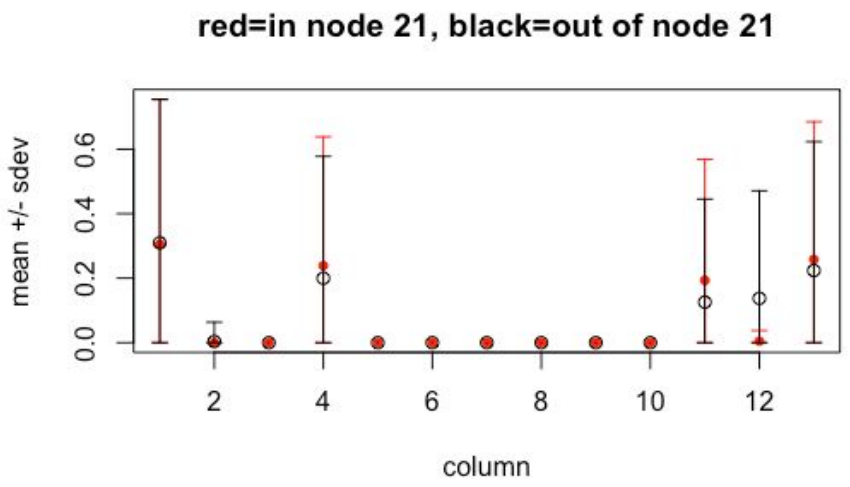
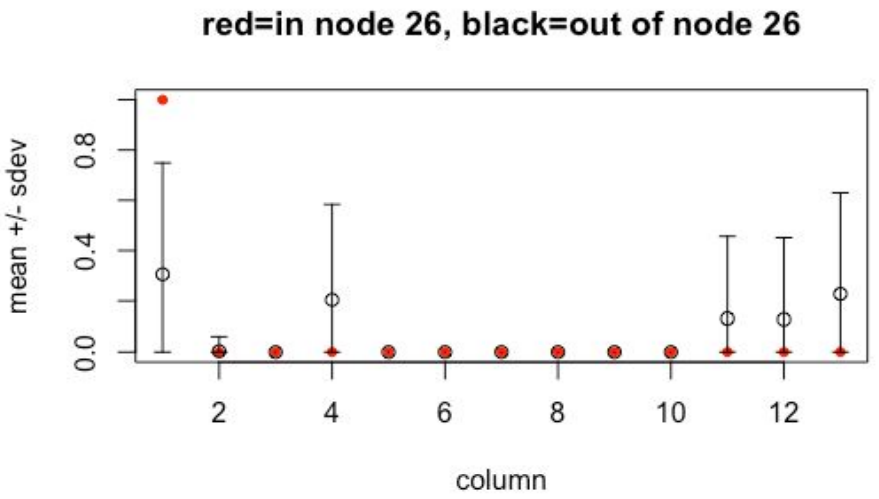
Node 19 has a normal profile, but node 21 has a low average in column corresponding to gym and fitness centers (column 12). Node 26 has a low average here as well, and also has low averages in columns corresponding to athletic fields, golf, and outdoors (columns 4, 11, 13). However, node 26 has a high average in stadiums and arenas (column 1). We conclude that, for this example, the Mapper algorithm revealed much finer granularity than hierarchical clustering.
Call Center
Mapper was also used to investigate a 10,000-record sample of call center data. The initial goal was to find trends over time, but after a week of little success this goal was replaced with an anomaly detection approach. The topological network below was structured by comparing each call’s queue, team name, and location name, and colored by the amount of time needed to accept the call (green = short, red = long).
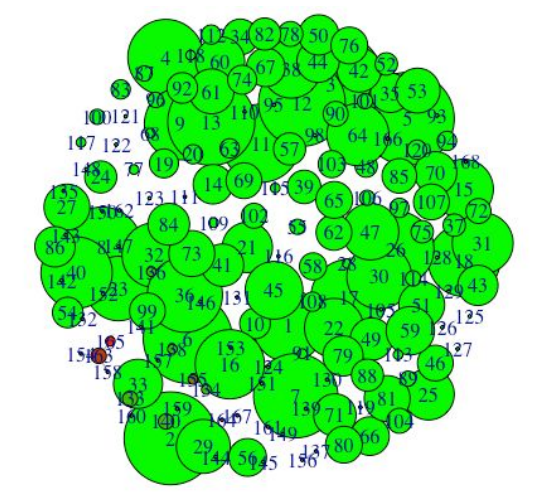
Ideally, calls should be accepted quickly. However, we can see that clusters 163 and 165, corresponding to the tech team from a particular location, are associated with abnormally long times to accept calls. This example demonstrates how Mapper can reveal insights from data even when the data is sparse and non-cohesive and the resulting network does not appear to contain any clear paths between nodes.
This post is part of the series The Data Scientist's Guide to Topological Data Analysis.
Want to get notified about new posts? Join the mailing list and follow on X/Twitter.