Sketching Graphs of Polynomials
We can sketch the graph of a polynomial using its end behavior and zeros.
This post is part of the book Justin Math: Algebra. Suggested citation: Skycak, J. (2018). Sketching Graphs of Polynomials. In Justin Math: Algebra. https://justinmath.com/sketching-graphs-of-polynomials/
Want to get notified about new posts? Join the mailing list and follow on X/Twitter.
In the previous posts, we learned how to find end behavior, zeros, and factored forms of polynomials. In this chapter, we will put all this information together to sketch graphs of polynomials.
End Behavior
End behavior tells us whether the polynomial goes up or down as we move away from the origin.
For example, if the end behavior is $p(x) \to -\infty$ as $x \to +\infty$ and $p(x) \to +\infty$ as $x \to -\infty$, then we know that the polynomial goes down as we go right, and up as we go left.
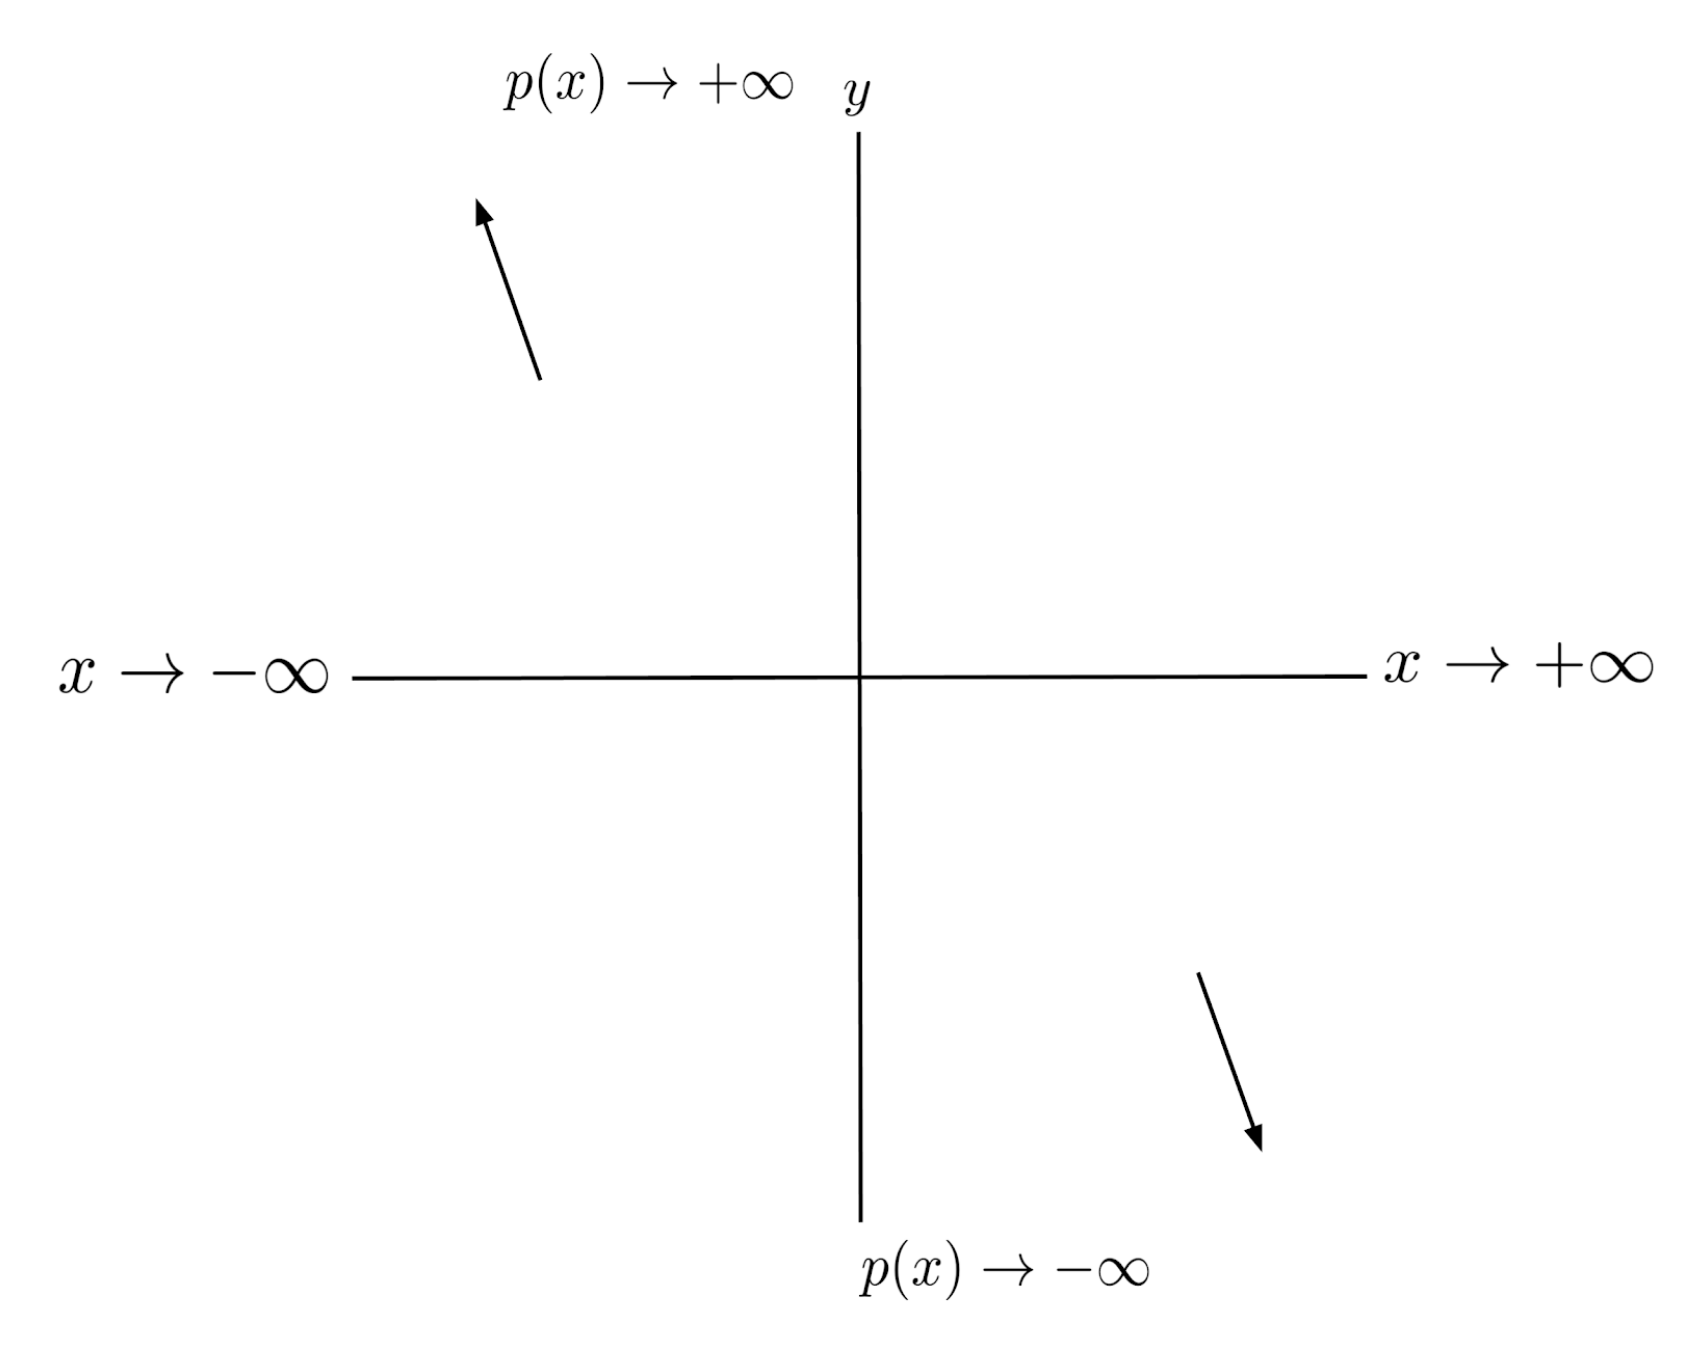
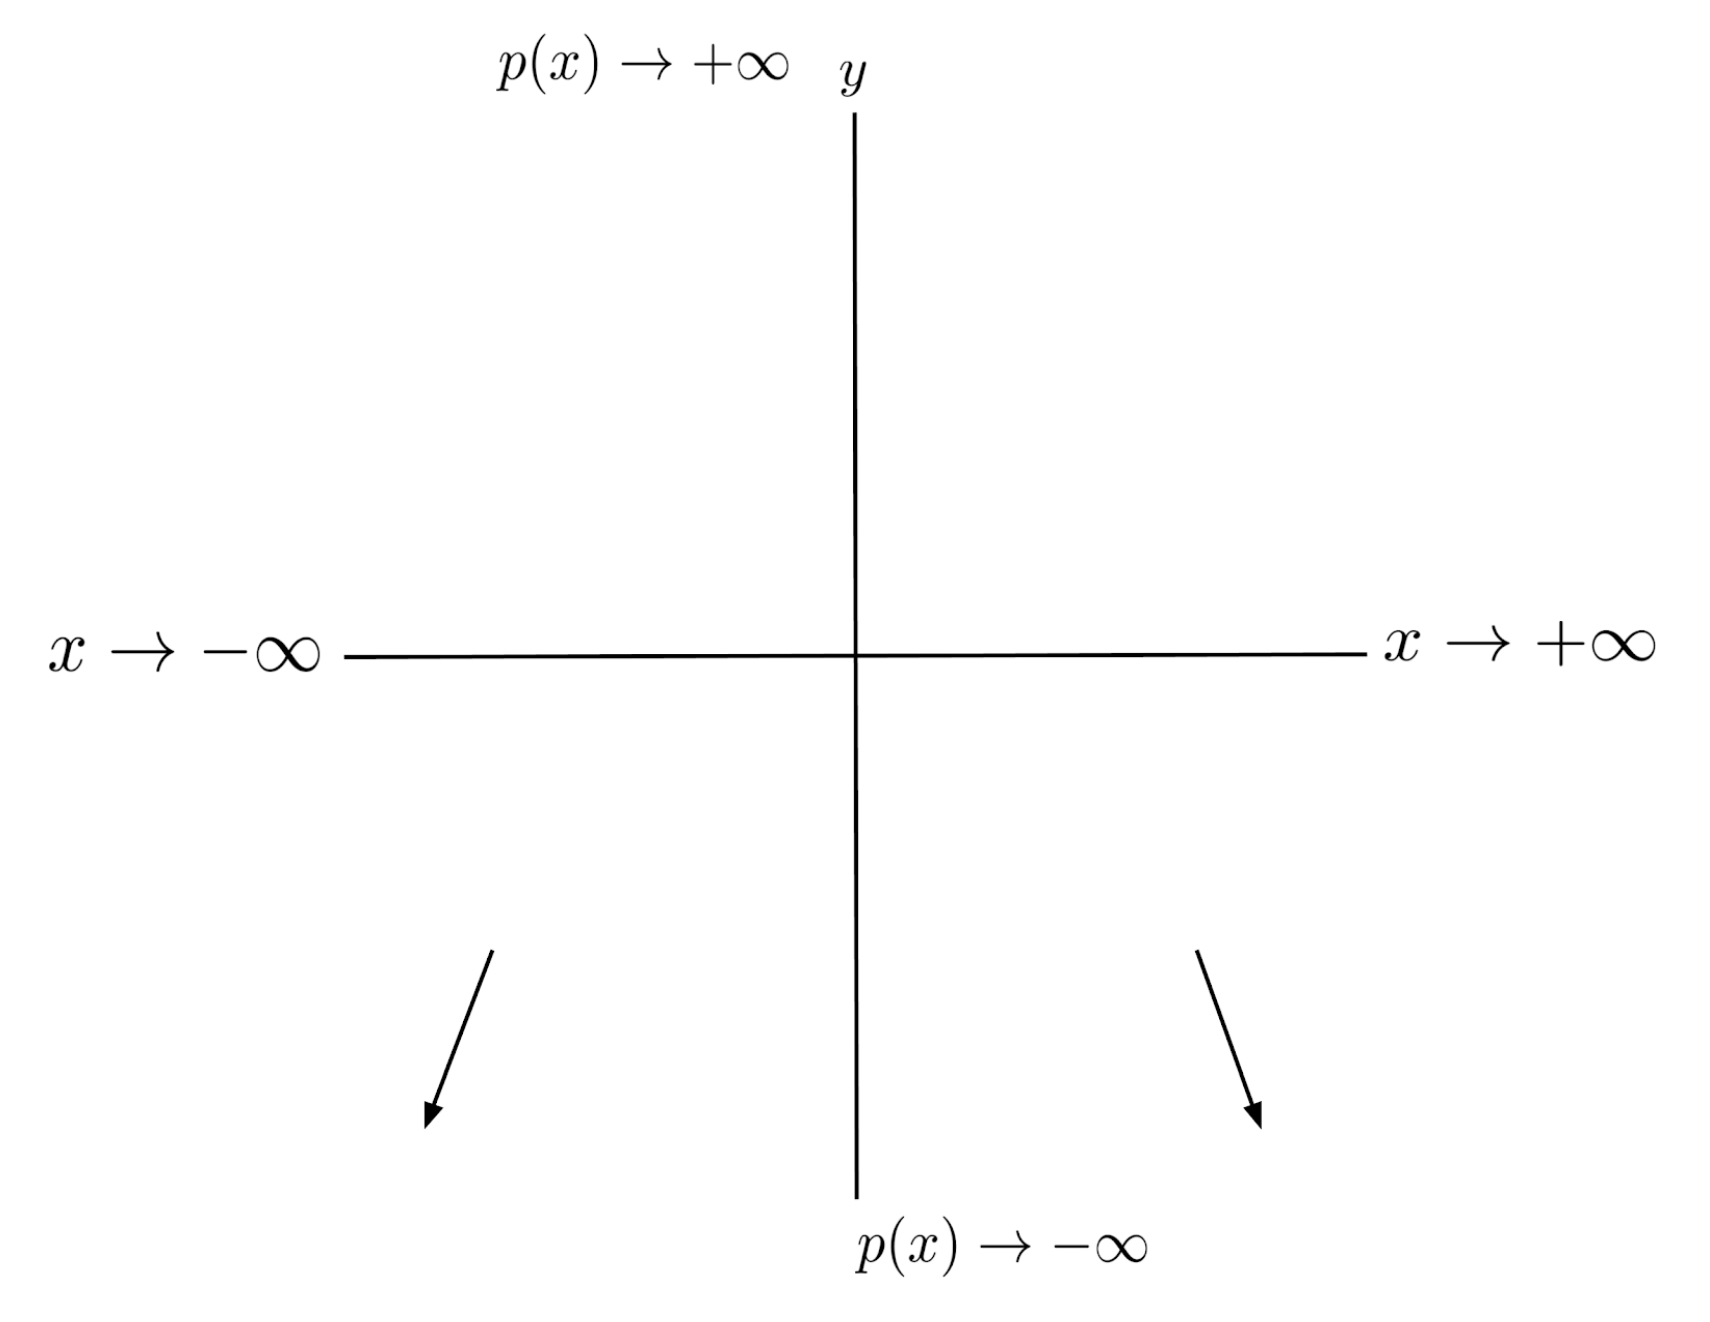
Similarly, if the end behavior is $p(x) \to -\infty$ as $x \to +\infty$ and $p(x) \to -\infty$ as $x \to -\infty$, then we know that the polynomial goes down as we go right, and down as we go left.
Zeros
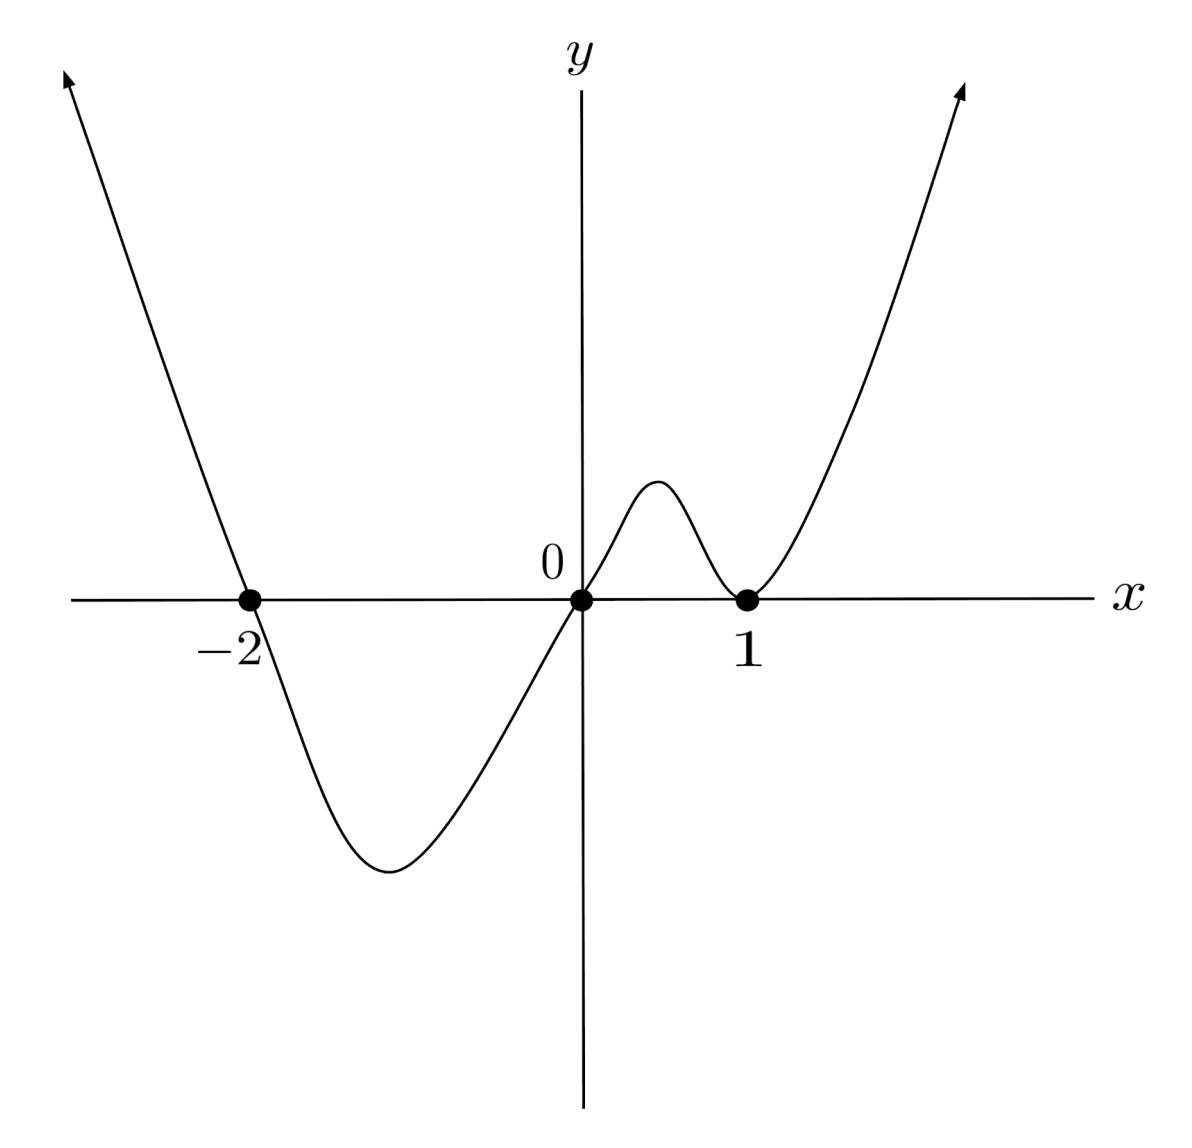
The zeros tell us where the polynomial crosses the x-axis, and the factored form tells us whether the polynomial crosses or doubles back at each zero: if the exponent of the factor is odd, then the polynomial crosses; if the exponent of the factor is even, then the polynomial doubles back.
For example, if the factored form of polynomial is $p(x)=x(x+2)(x-1)^2$, then the polynomial crosses the x-axis at $0$ and $-2$, and doubles back at $1$. Combining this information with the end behavior, which is $p(x) \to +\infty$ as $x \to +\infty$ and as $p(x) \to +\infty$, we can draw a rough sketch of the polynomial.
Demonstration
Let’s sketch a rough graph of the following polynomial:
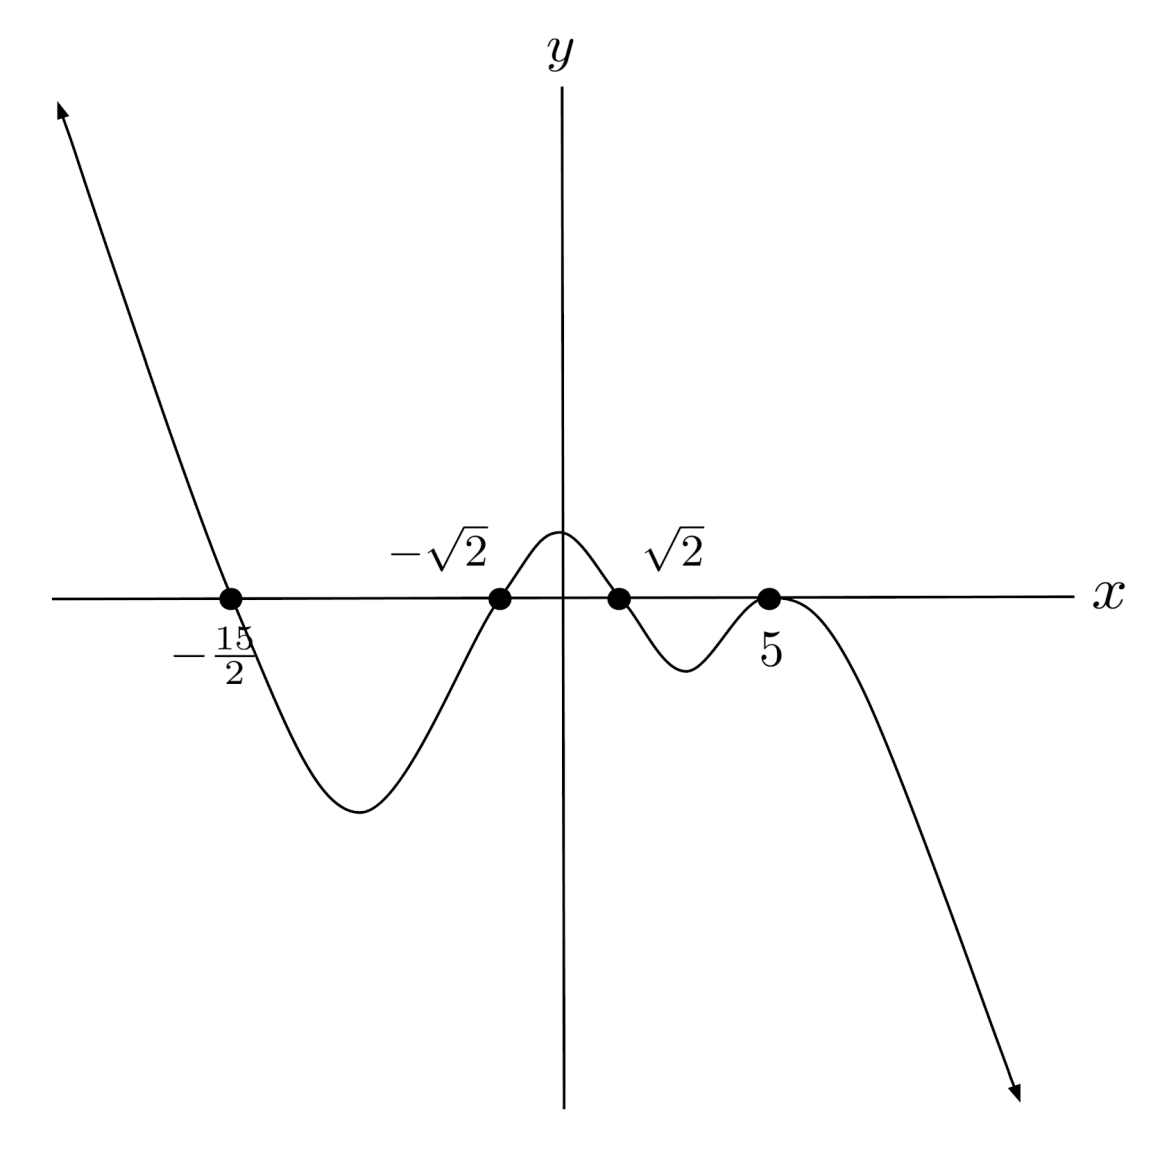
We first find the leading coefficient, $-(2x)(x)^3(x)^3(x)^6$, which tells us the end behavior: $p(x) \to -\infty$ as $x \to +\infty$, and $p(x) \to +\infty$ as $x \to -\infty$.
Then, we can look at the factors and their exponents to find the zeros and tell whether the polynomial crosses the x-axis or doubles back at each zero.
To sketch the graph, we draw our end behavior, plot the zeros on the x-axis, and then connect them with the correct crossing or doubling back behavior.
Exercises
Sketch a rough graph of each polynomial. (You can view the solution by clicking on the problem.)
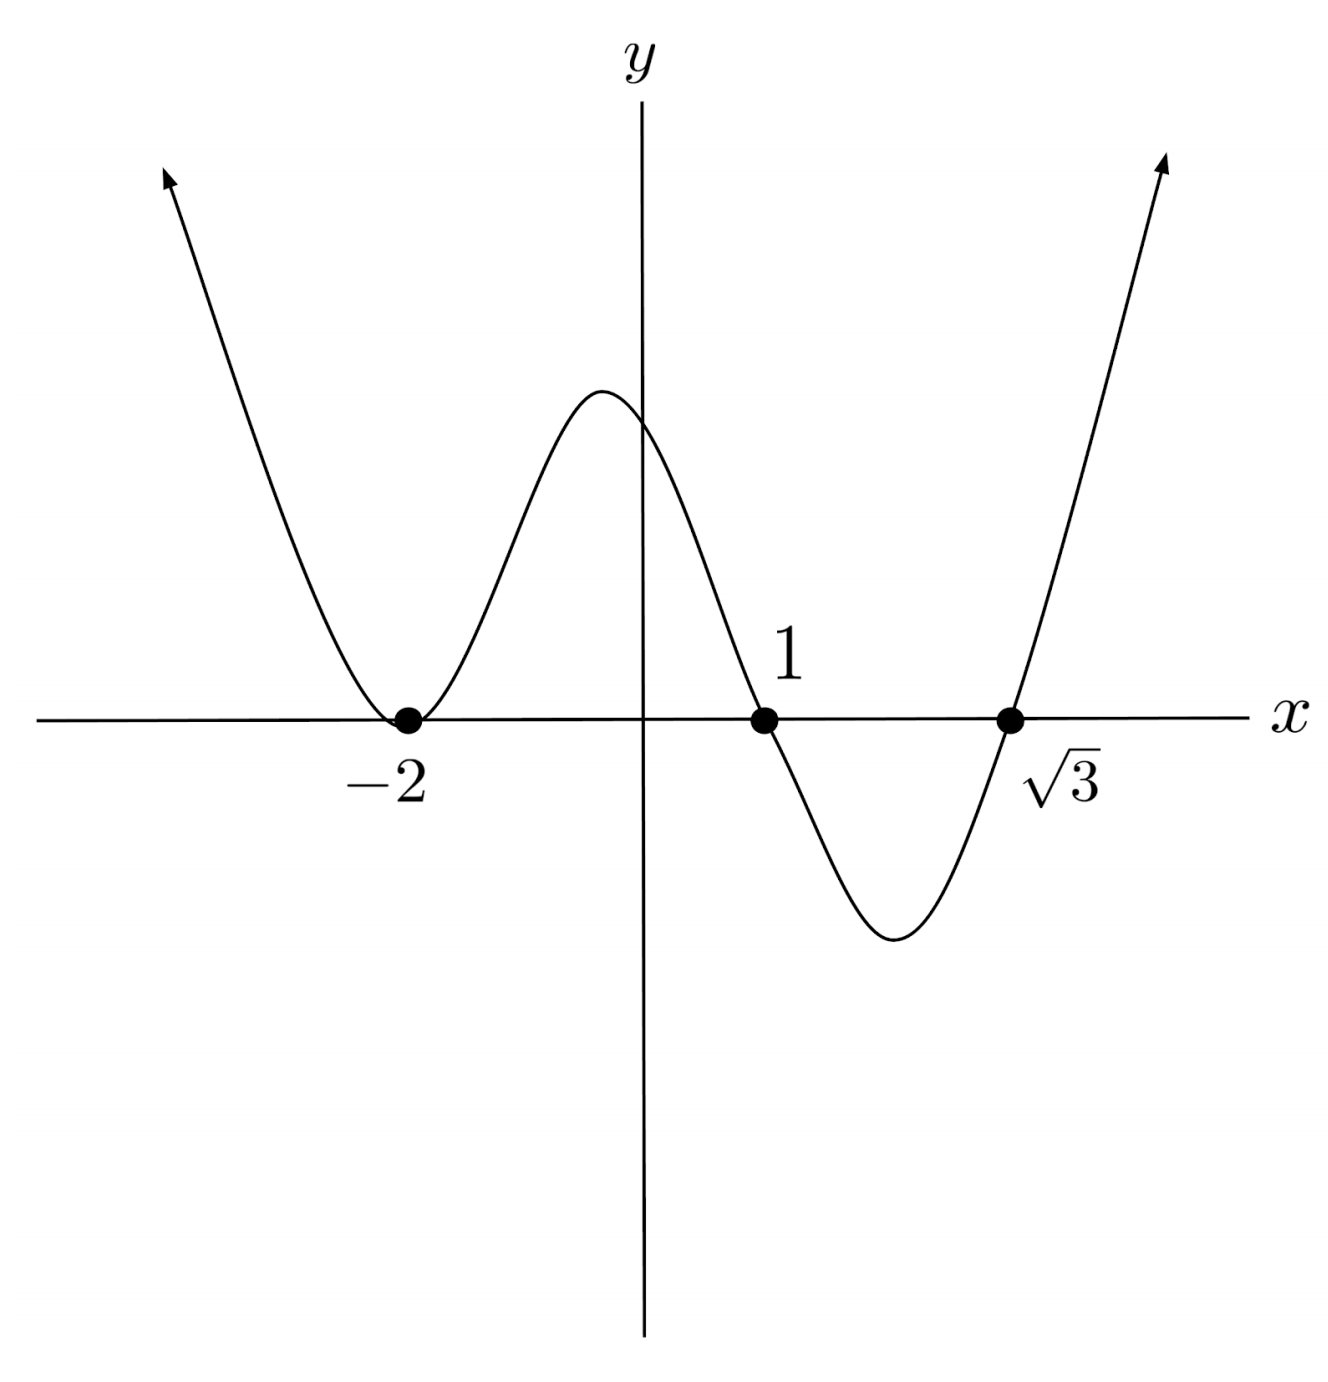
$1) \hspace{.5cm} p(x)=(x-1)^3(x+2)^2(x-3)$
Solution:
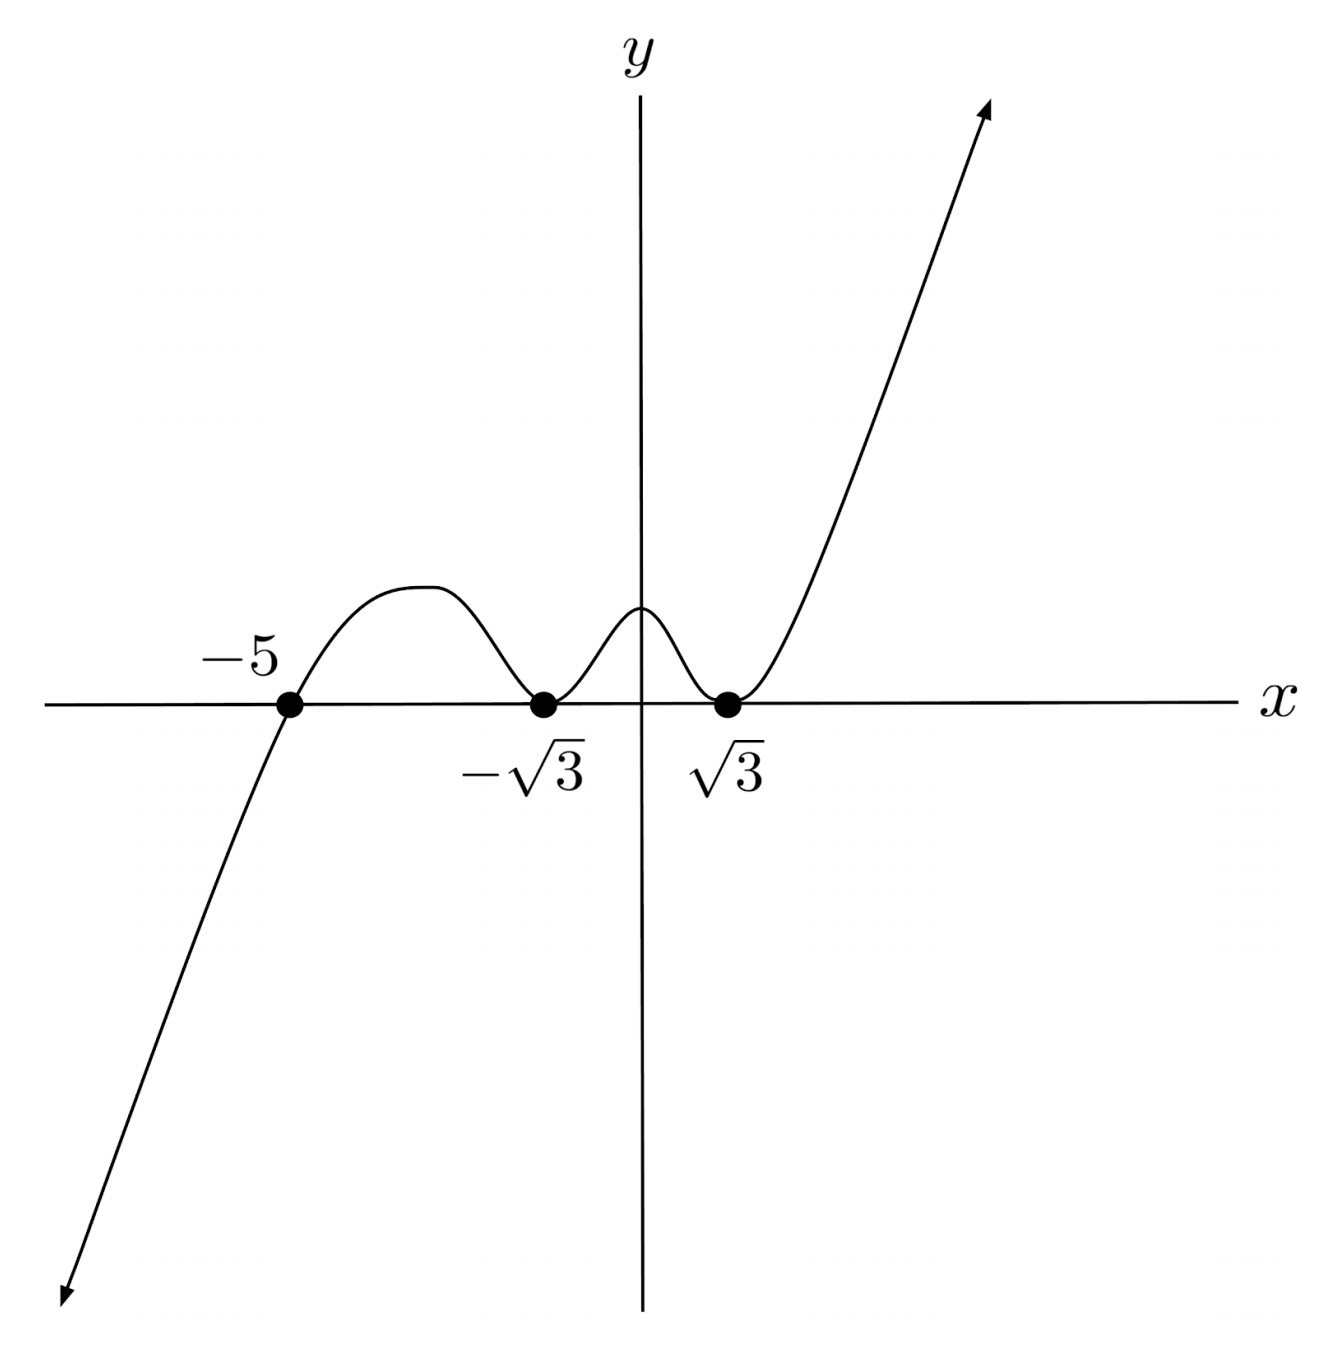
$2) \hspace{.5cm} p(x)=(x+5)^3(x-\sqrt{3})^2(x+\sqrt{3})^2$
Solution:
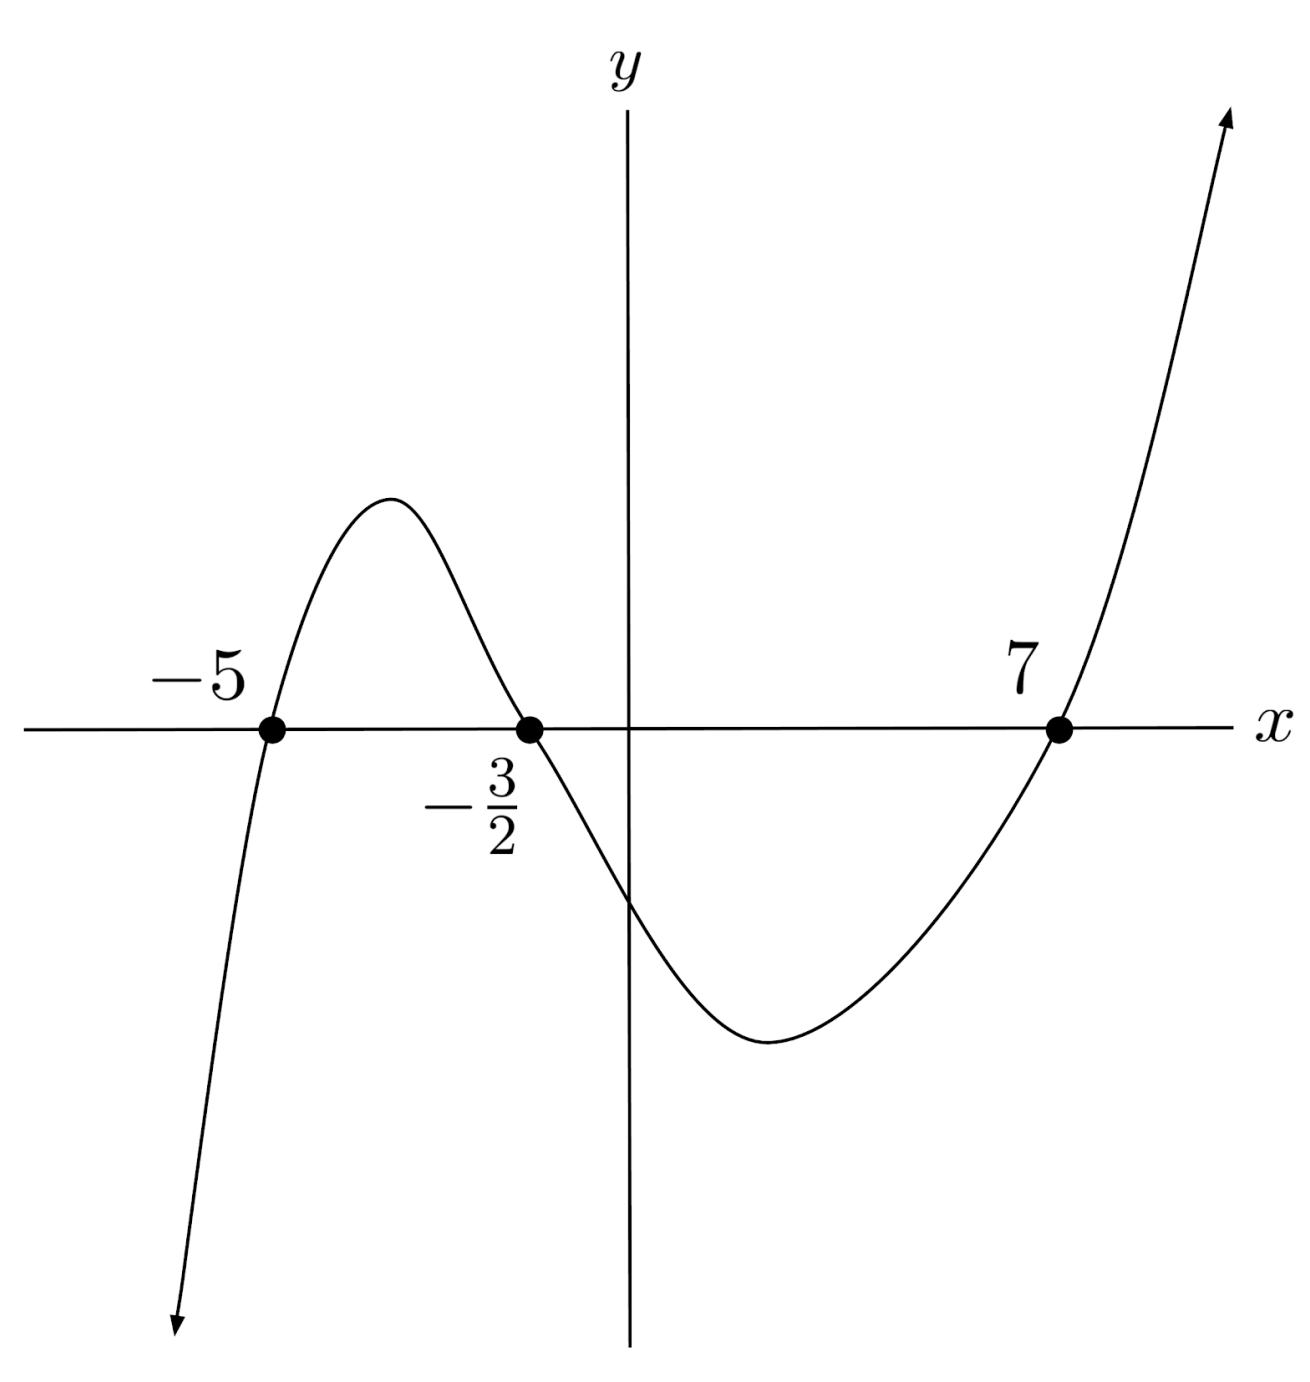
$3) \hspace{.5cm} p(x)=-(2x+3)^3(x+5)(x-7)^8$
Solution:
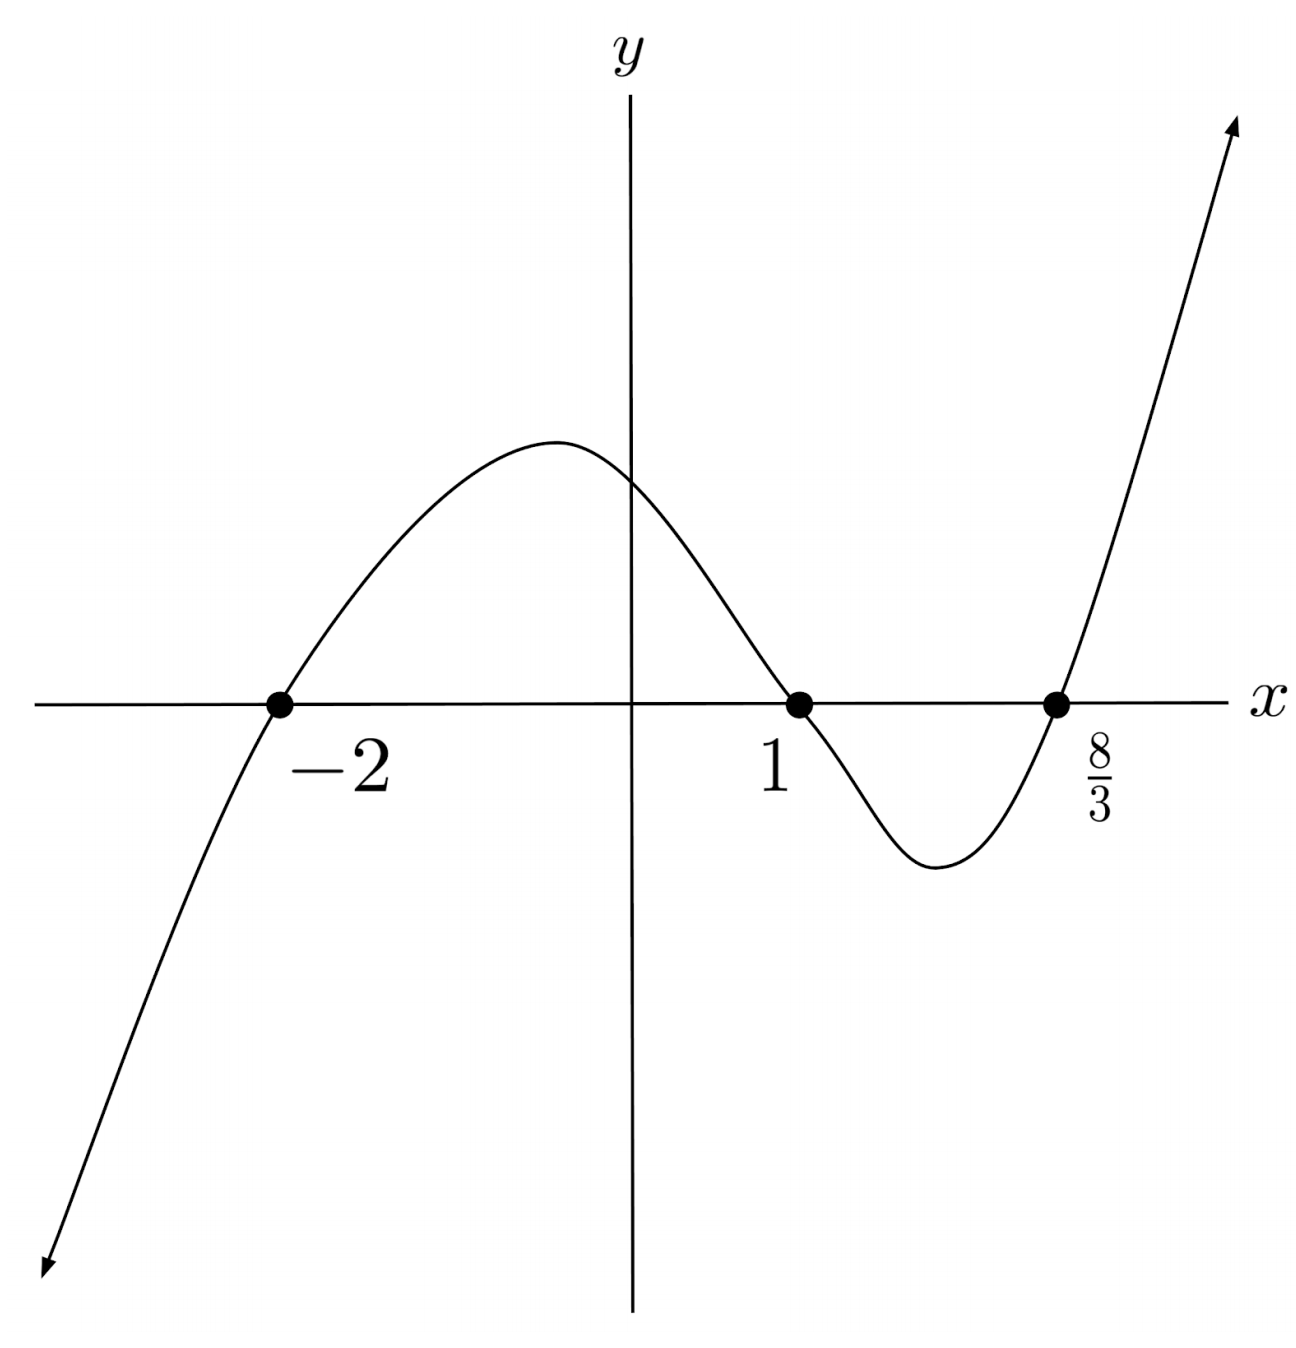
$4) \hspace{.5cm} p(x)=(x+2)(x-1)(3x-8)$
Solution:
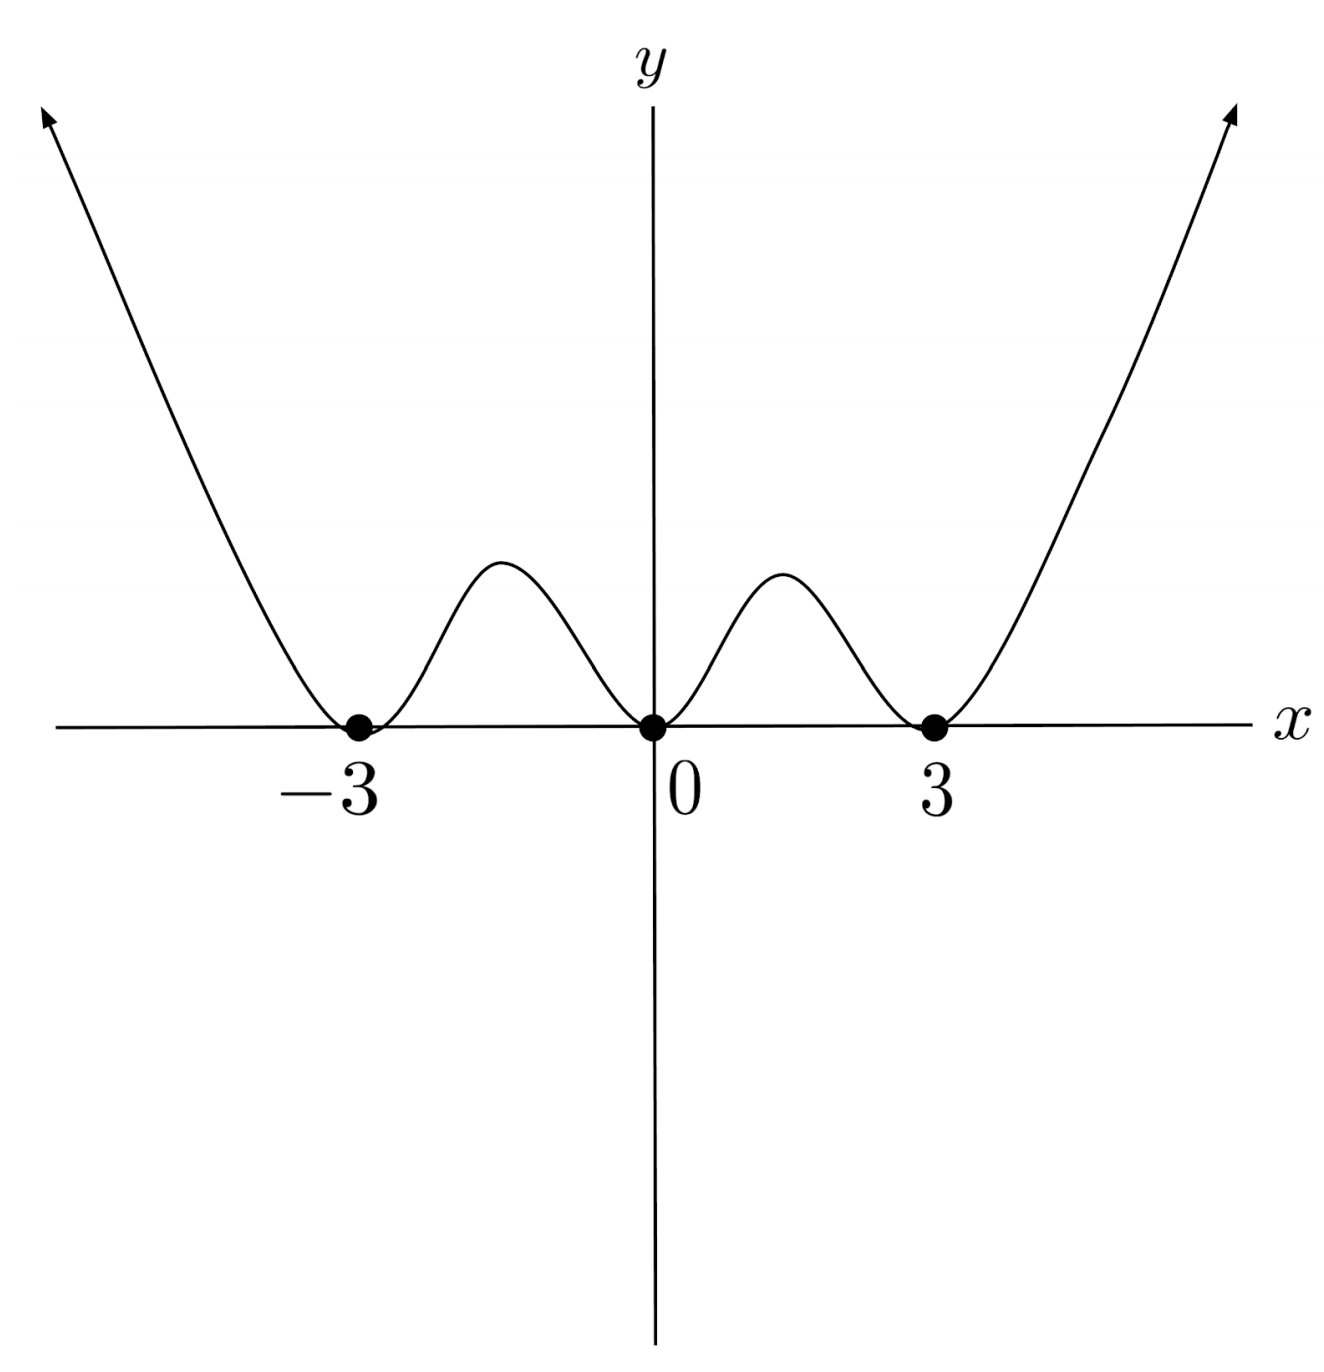
$5) \hspace{.5cm} p(x)=x^2(x+3)^2(x-3)^4$
Solution:
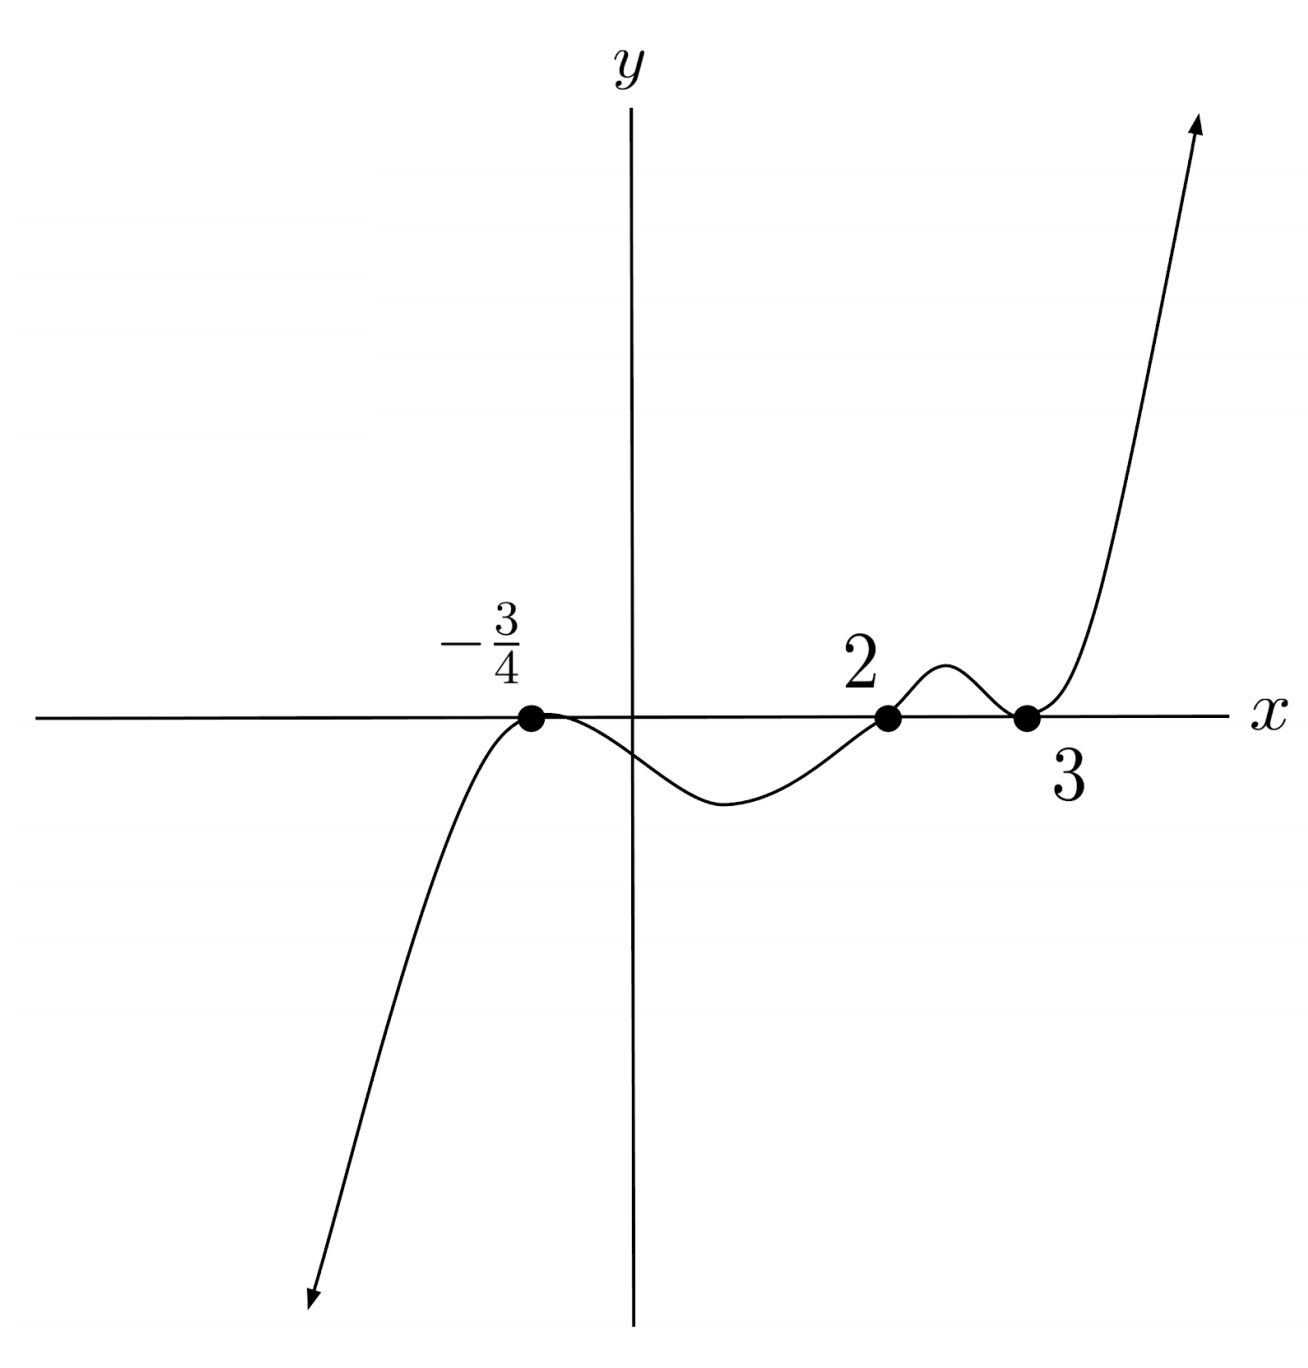
$6) \hspace{.5cm} p(x)=-(4x+3)^{12}(3-x)^9(x-2)^{10}$
Solution:
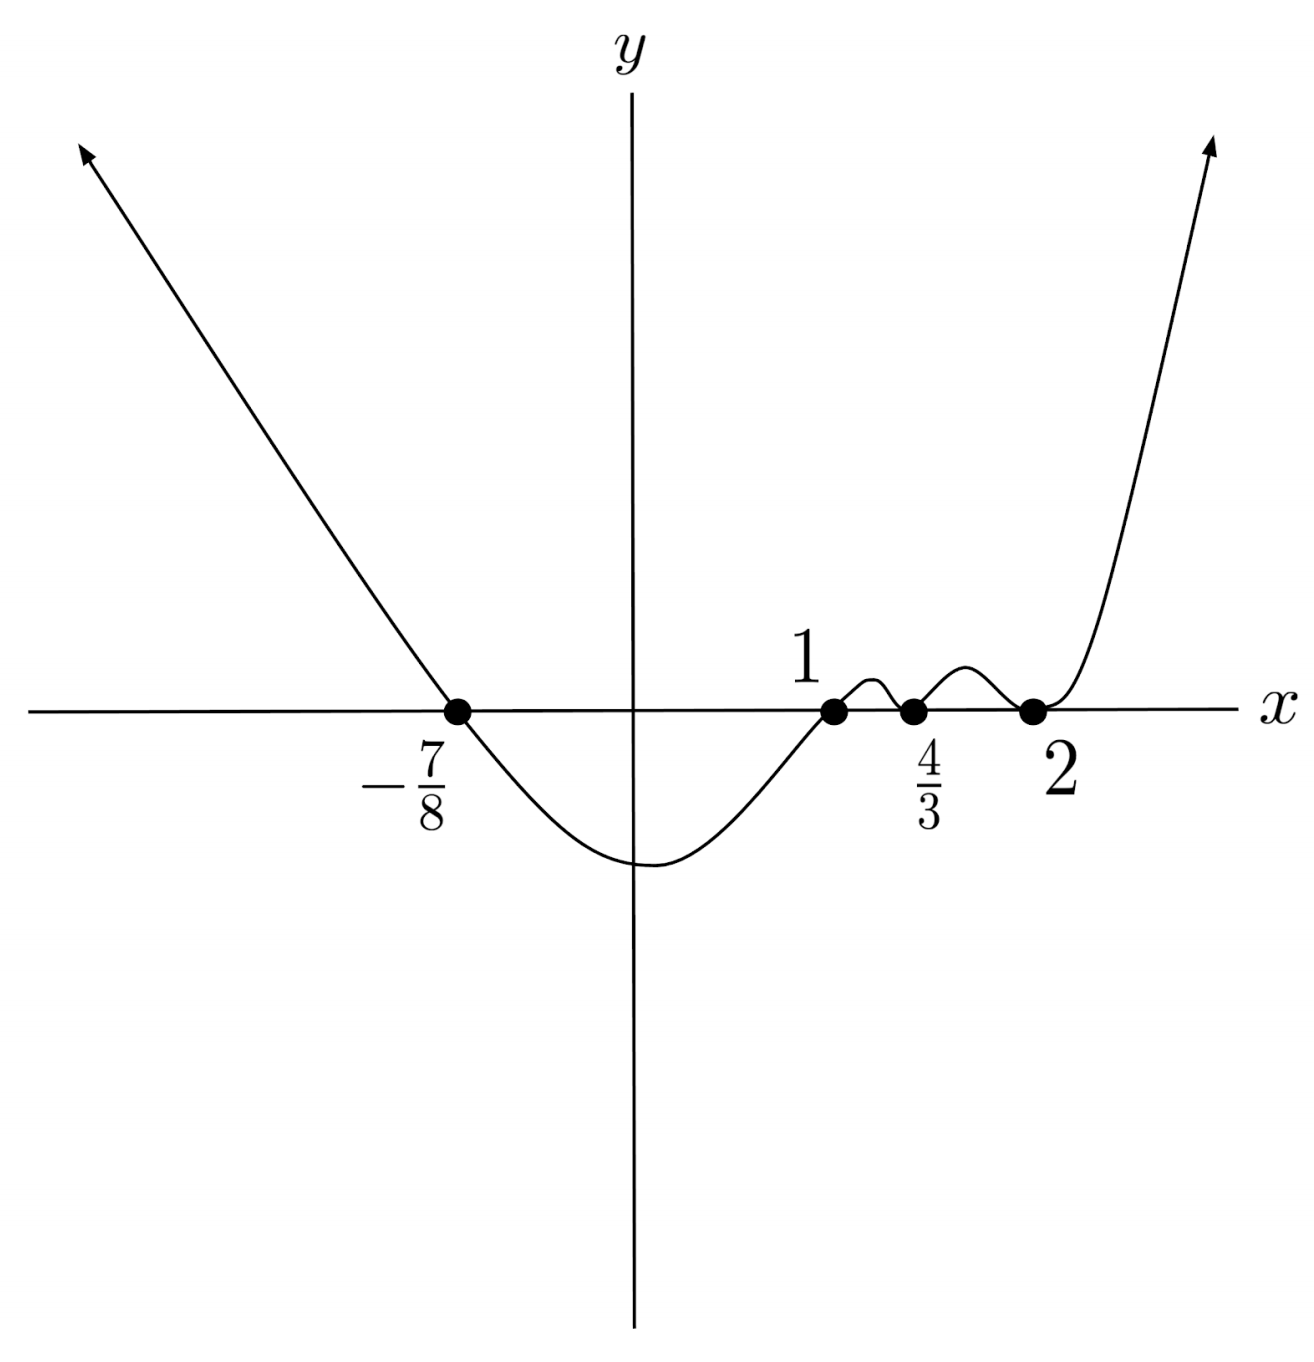
$7) \hspace{.5cm} p(x)=(3x-4)^{20}(8x+7)^{11}(x-1)^{31}(x-2)^{18}$
Solution:
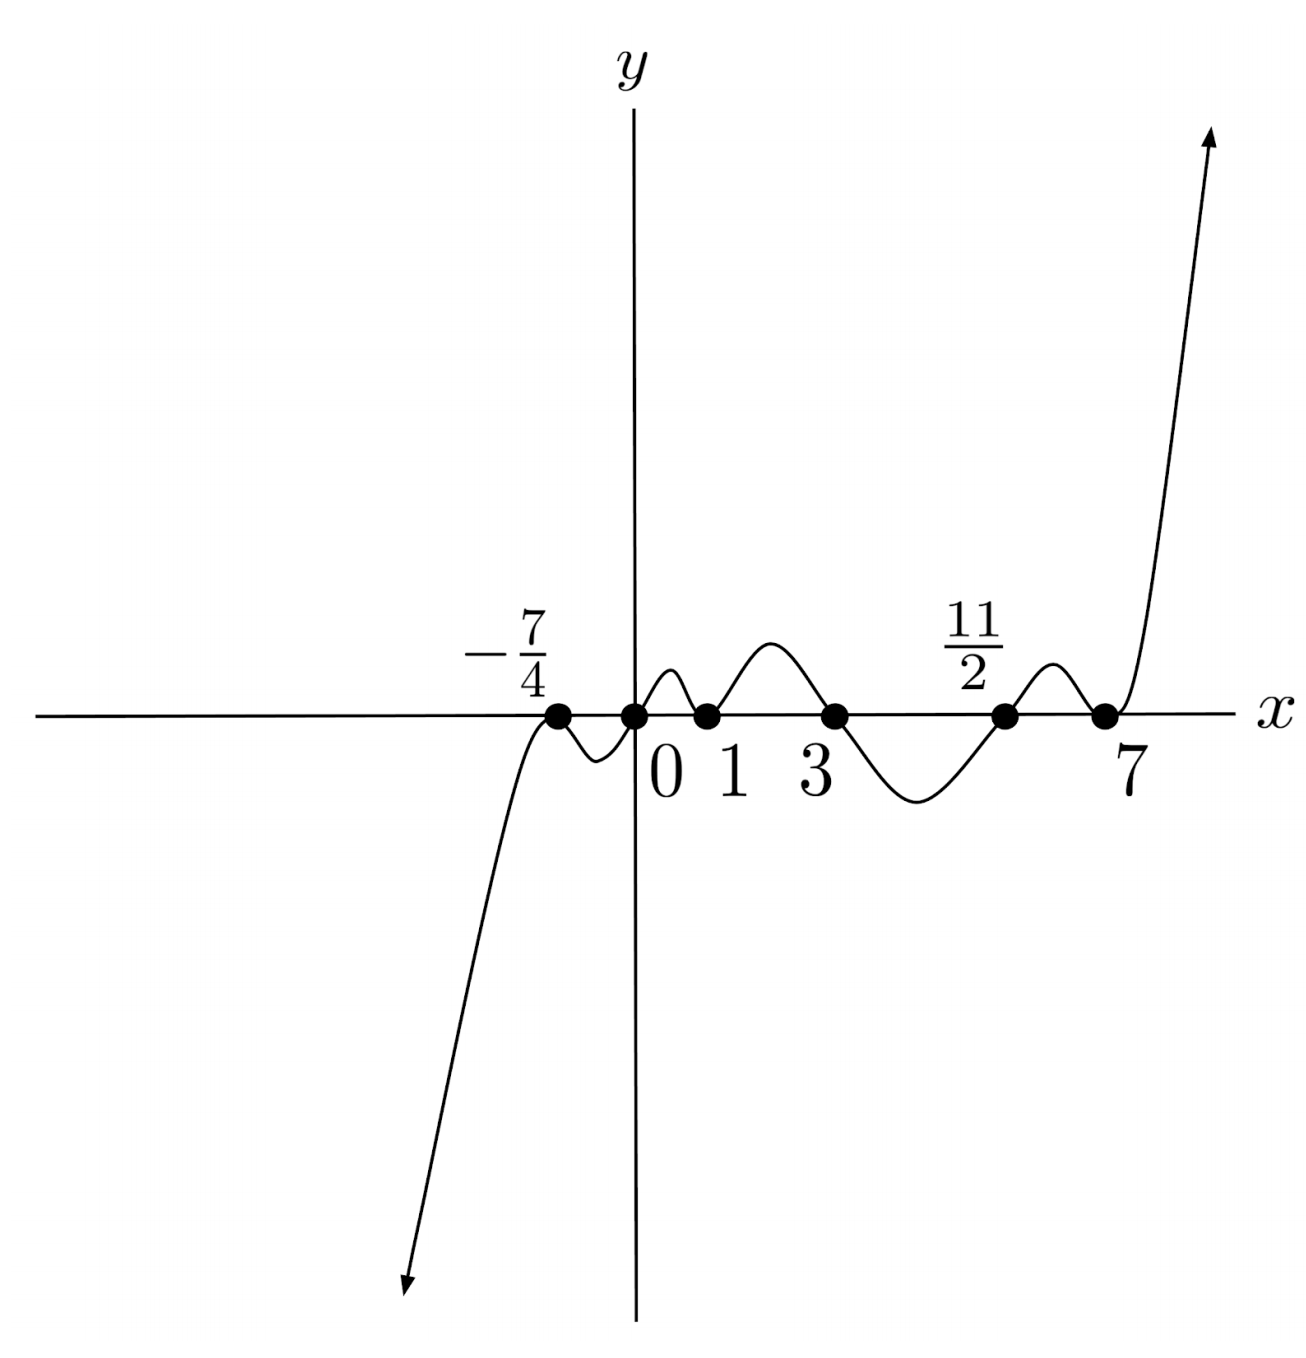
$8) \hspace{.5cm} p(x)=-x^{99}(2x-11)^{15}(x-3)(4x+7)^{32}(x-1)^2(x-7)^4$
Solution:
This post is part of the book Justin Math: Algebra. Suggested citation: Skycak, J. (2018). Sketching Graphs of Polynomials. In Justin Math: Algebra. https://justinmath.com/sketching-graphs-of-polynomials/
Want to get notified about new posts? Join the mailing list and follow on X/Twitter.