Memory vs Time Graphs
A way to visualize some cognitive learning strategies.
Want to get notified about new posts? Join the mailing list and follow on X/Twitter.
Some cognitive learning strategies can be understood best by visualizing them on graphs of memory vs time.
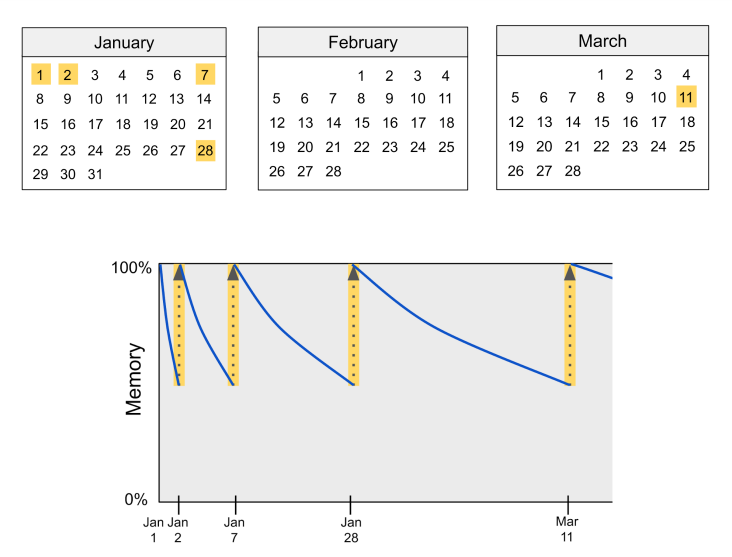
Consider “spaced repetition,” a systematic way of reviewing previously-learned material. A “repetition” is a successful review at the appropriate time.
After each repetition, your memory begins to decay. But the more repetitions you complete on the same material, the slower your memory decays, and the longer you can wait until the next repetition.
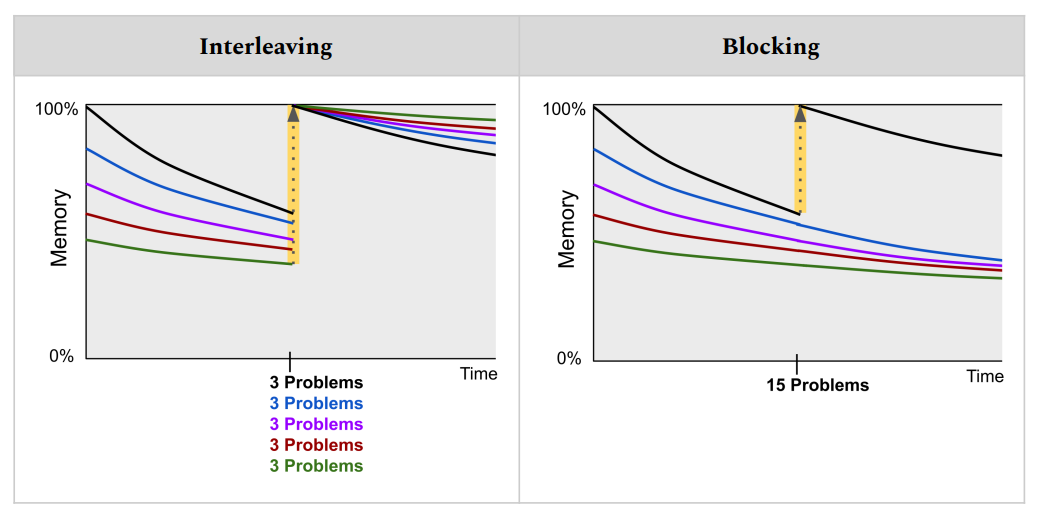
“Interleaving” – the act of spreading your practice across a broad mix of skills that you’ve previously learned – can be visualized on a similar type of graph.
To understand interleaving, it’s helpful to contrast with the opposite strategy, “blocked practice,” which involves practicing the same skill over and over in succession.
Scaffolding practice into blocks of increasing difficulty can be useful when initially learning a new skill – but afterwards, during review, blocking is far less efficient than interleaving.
After you solve a handful of problems and reach a minimum effective dose that refreshes your memory, further practice offers diminishing returns.
To visualize interleaving vs blocked practice on a memory-vs-time graph, we can consider the effect of a minimum effective dose (say, 3 problems) on 5 different topics vs the equivalent excessive dose (15 problems) concentrated on a single topic.
As you can see in the graph, interleaving allows us to fully elevate many different memory curves, not just one!
Want to get notified about new posts? Join the mailing list and follow on X/Twitter.