Graphing Calculator Drawing: Sine Waves
Sine waves can be used to draw scales on a fish.
This post is part of the book Graphing Calculator Drawing Exercises. Suggested citation: Skycak, J. (2019). Graphing Calculator Drawing: Sine Waves. In Graphing Calculator Drawing Exercises. https://justinmath.com/graphing-calculator-drawing-sine-waves/
Want to get notified about new posts? Join the mailing list and follow on X/Twitter.
Setup. Navigate to https://www.desmos.com/calculator. Be sure to sign in so that you can save your graph.
Demonstration - Equilibrium. Observe the graph as you type each of the following inputs. In general, the graph of $y=\sin x$ looks like an infinite wavy squiggle oscillating up and down around an equilibrium at $y=0.$ The graph $y=\sin(x)+b$ shifts the equilibrium of the wavy squiggle to the line $y=b.$
Demonstration - Frequency. Observe the graph as you type each of the following inputs. The “frequency” of a sine wave refers to how quickly or “frequently” it oscillates. For a sine wave $y=\sin(vx),$ the frequency is controlled by $v.$ If you double $v,$ then the sine wave will oscillate twice as frequently; if you halve $v,$ then the sine wave will oscillate half as frequently. If you set $v=0,$ then the sine wave will not oscillate at all.
Demonstration - Amplitude. Observe the graph as you type each of the following inputs. The “amplitude” of a sine wave refers to how high/low its peaks/valleys are in relation to its equilibrium. For a sine wave $y=A\sin(x),$ the amplitude is controlled by $A.$ The peaks of the sine wave reach a height of $A,$ and the valleys of the sine wave reach a depth of $-A.$
Demonstration - Horizontal Shift. Observe the graph as you type each of the following inputs. The sine graph $y=\sin(x-a)$ is shifted right $a$ units, meaning that each peak and each valley occurs $a$ units right of its original location.
Demonstration - Composition with Absolute Value. Observe the graph as you type each of the following inputs.
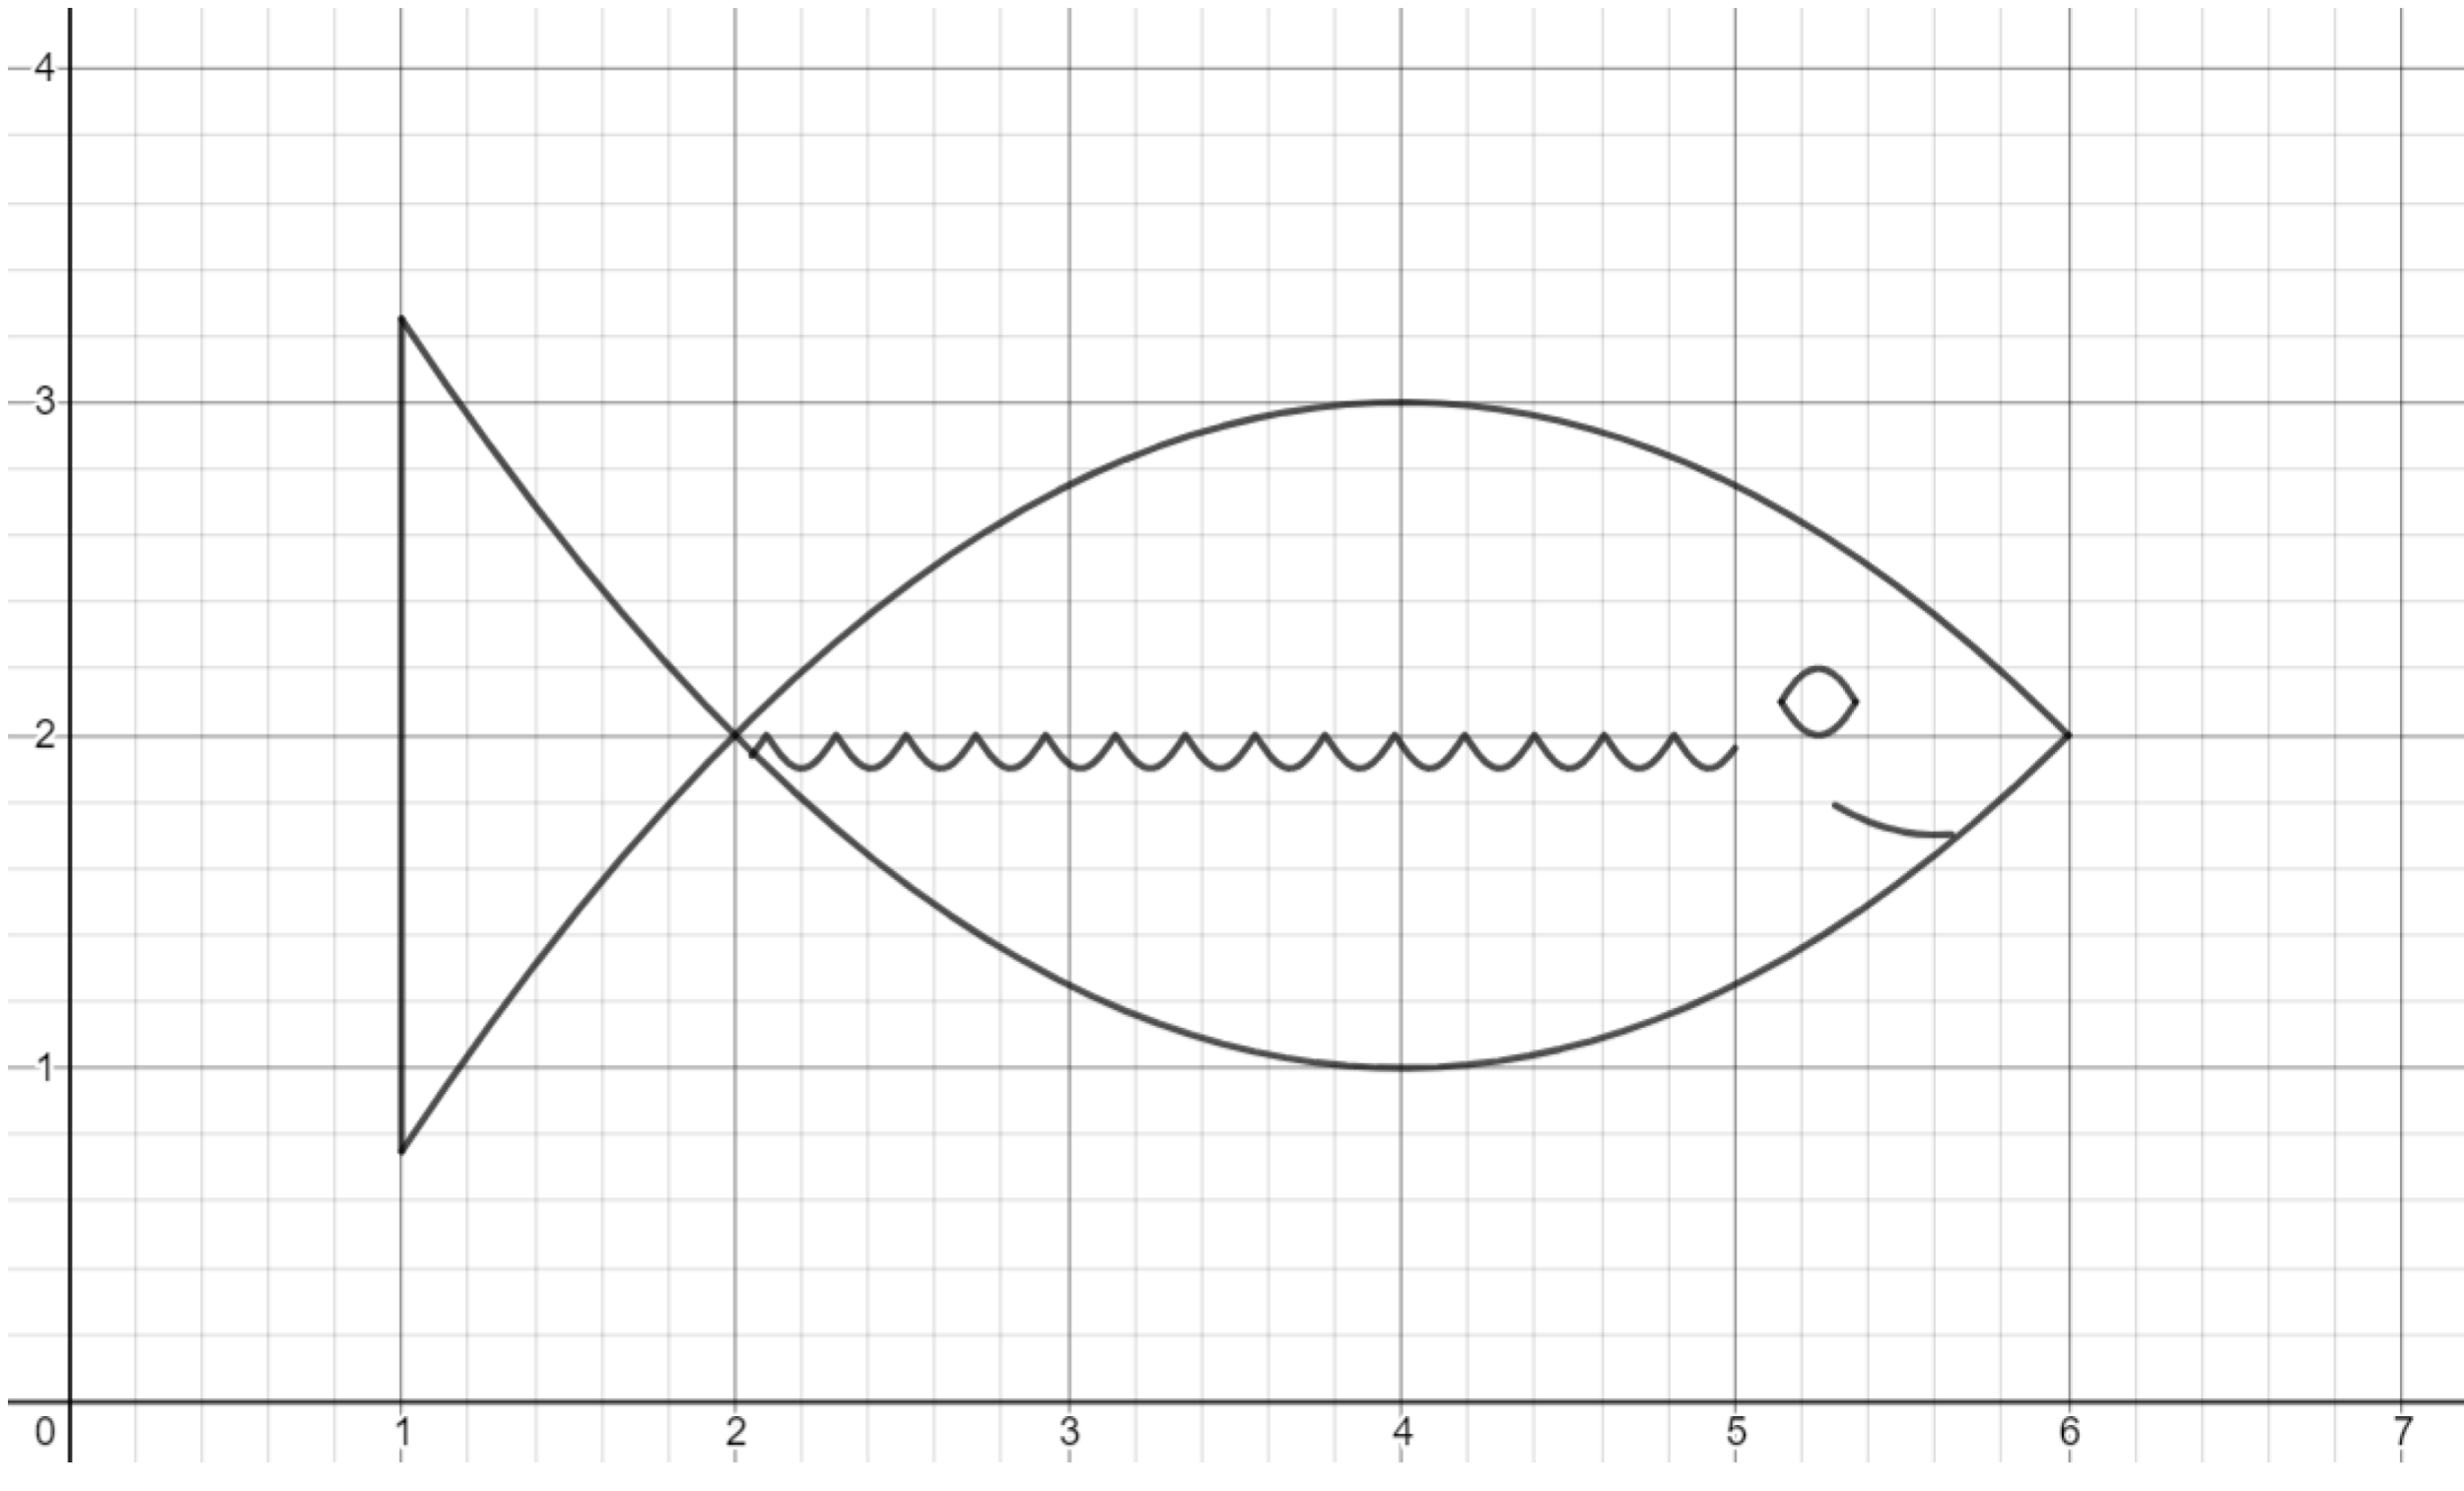
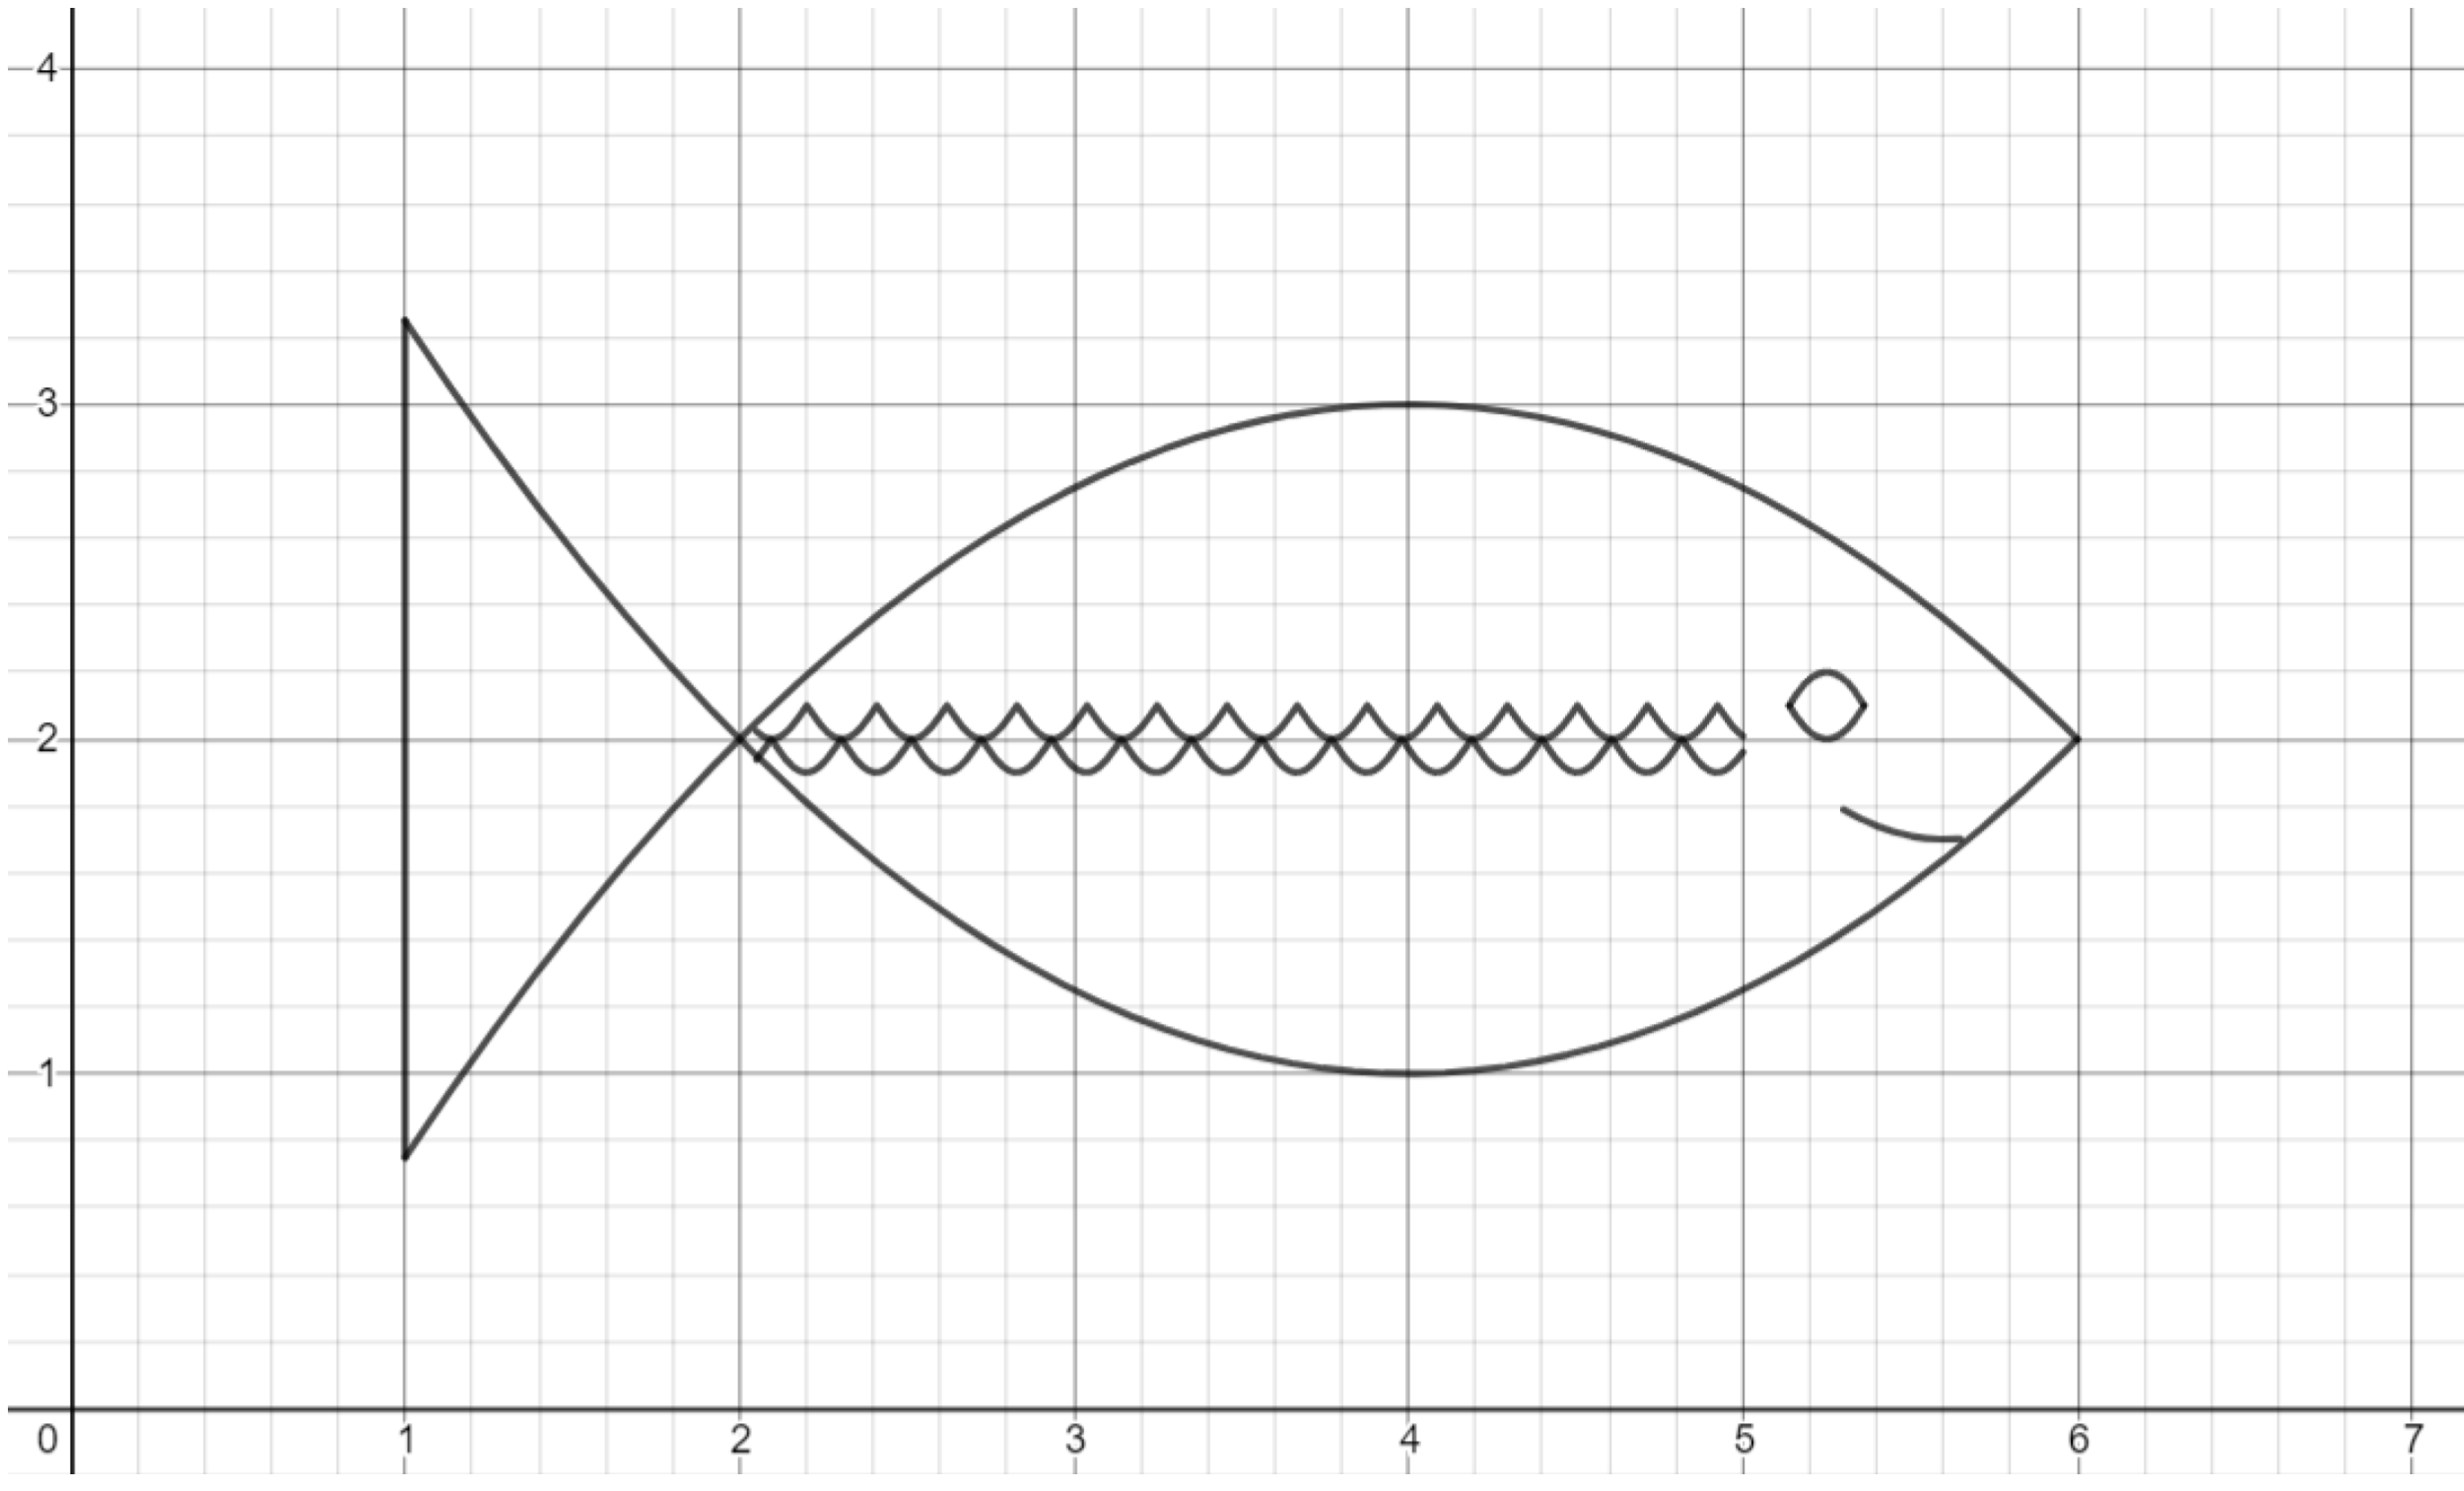
Exercise. Previously, you drew a fish using parabolas. Now, create a layer of scales on it, using a function of the form $y=-A \vert \sin(x) \vert +b.$
Exercise. Now, create a second layer of scales, using a function of the form $y=-A \vert \sin(x-a) \vert +b.$ The peaks of the first layer should line up with the valleys of the second layer.
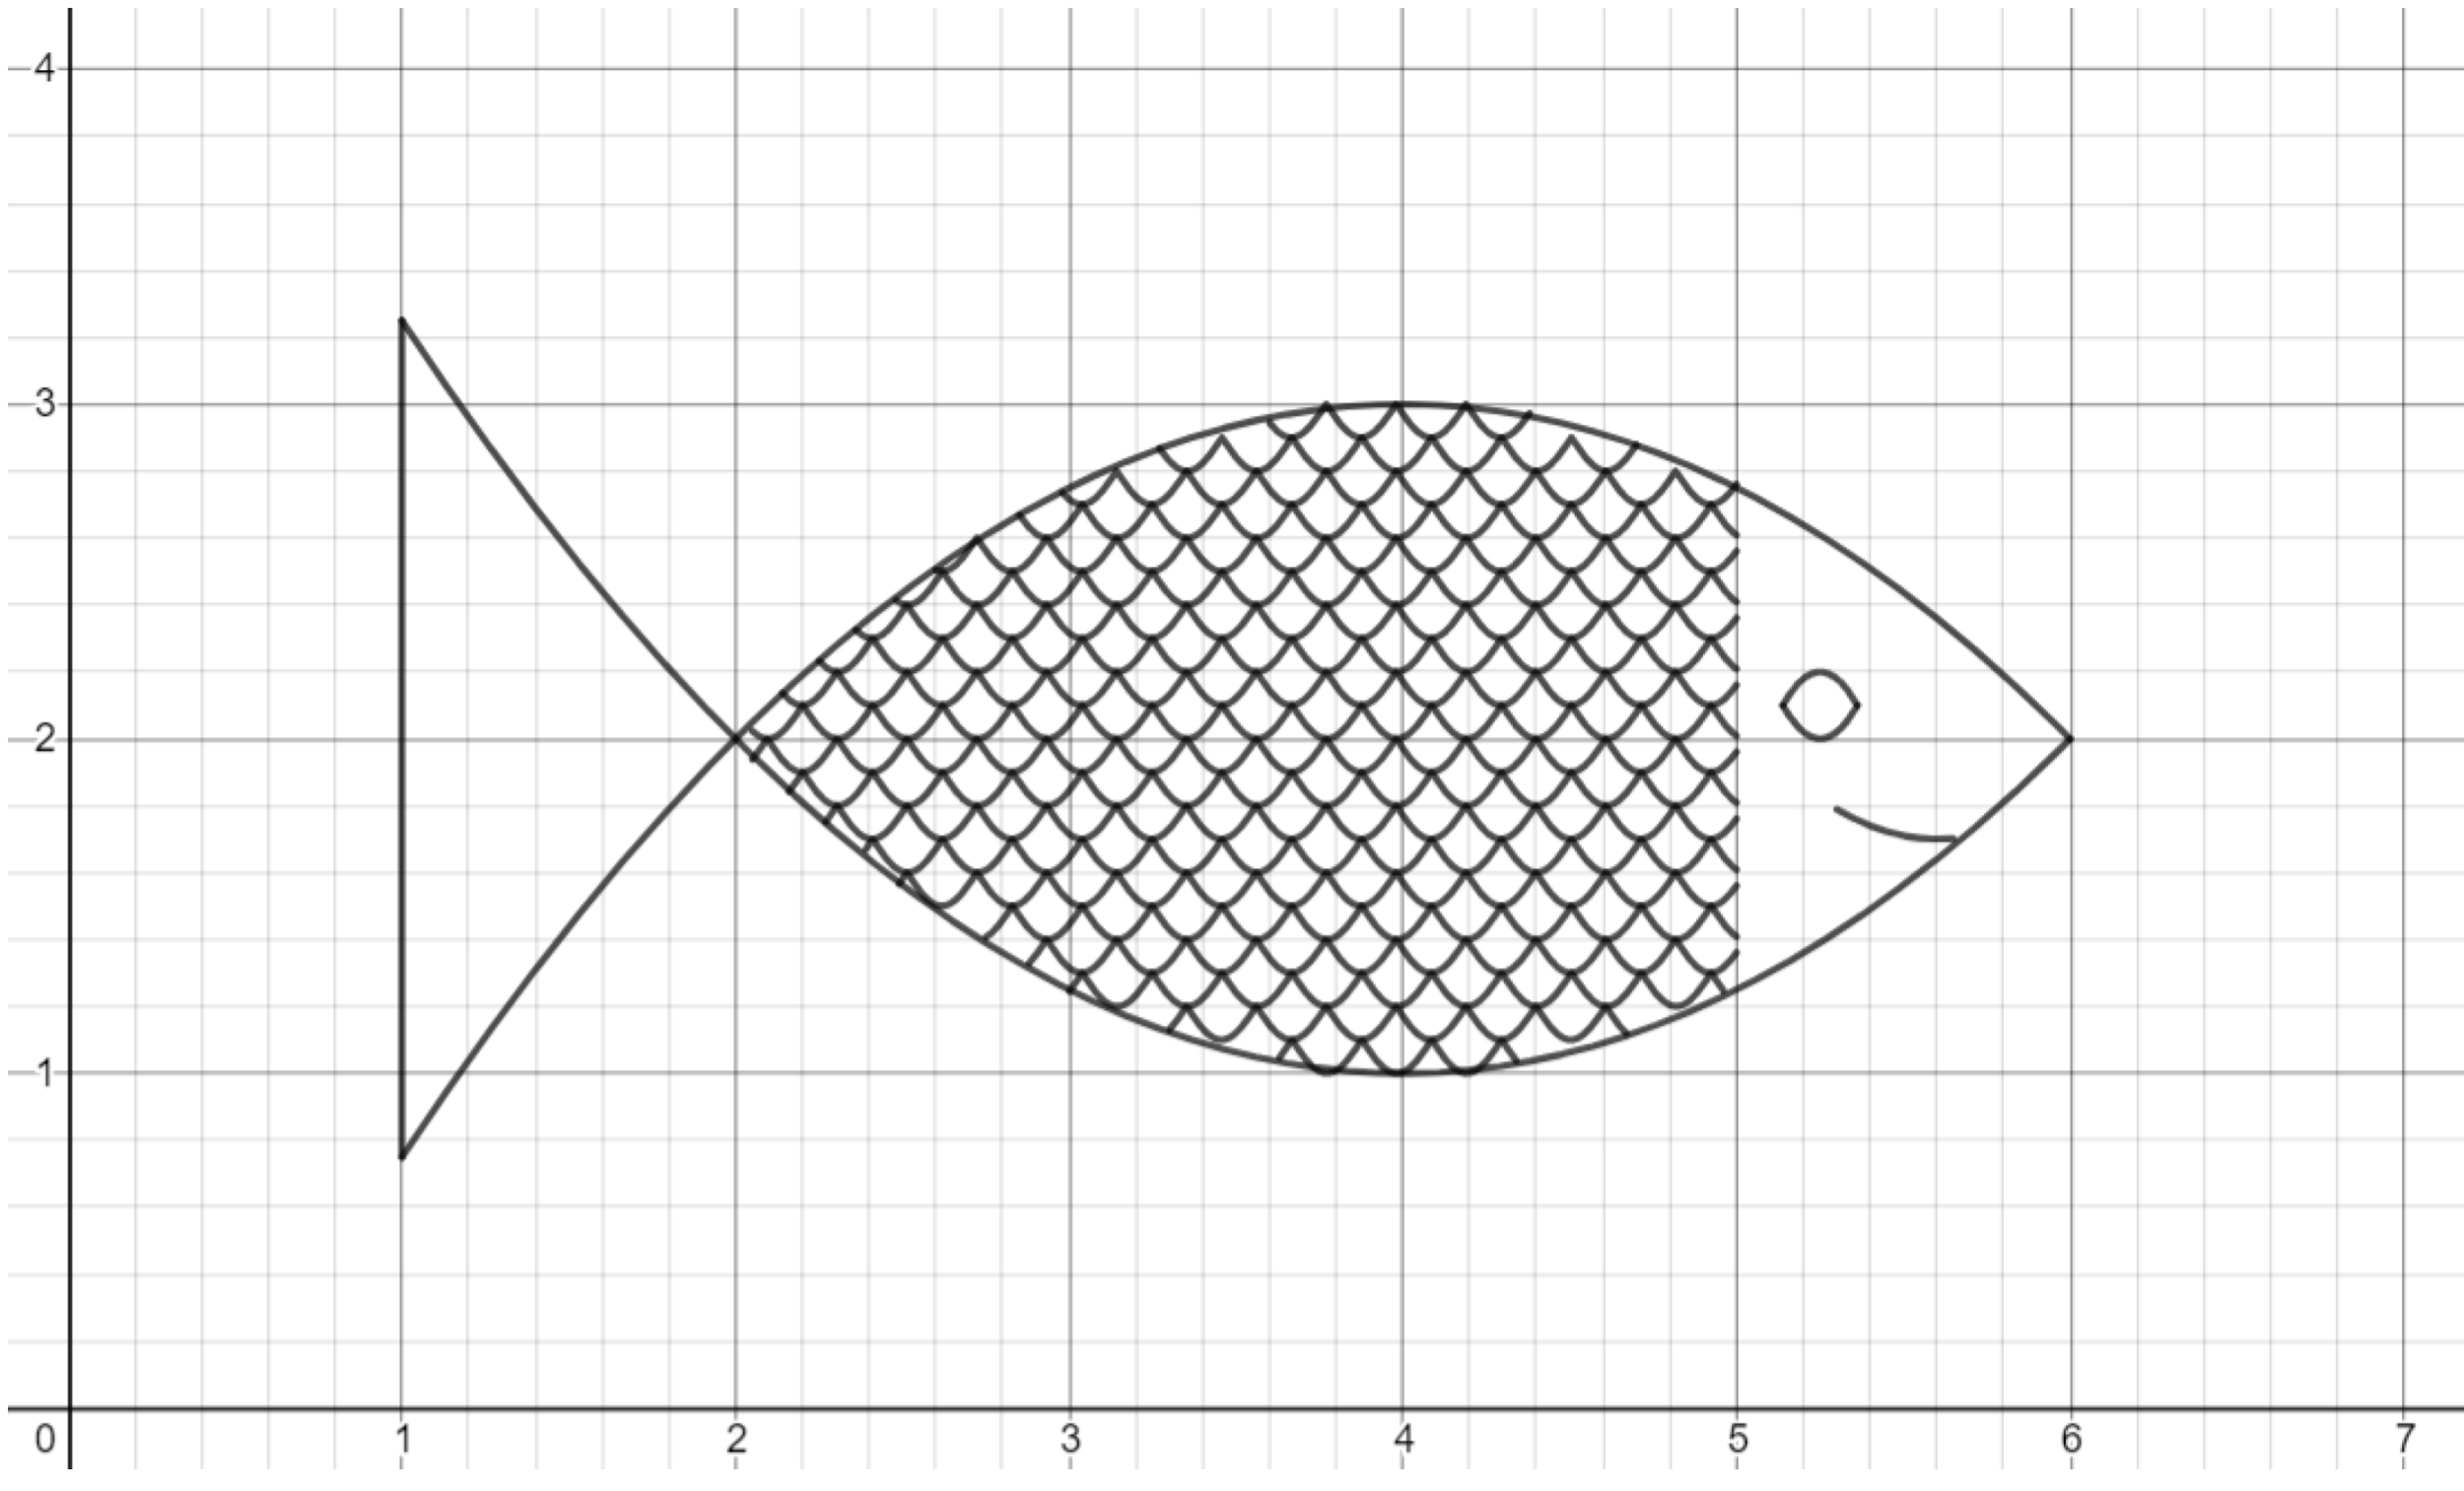
Exercise. Continue making layers of scales until the fish is completely scaled.
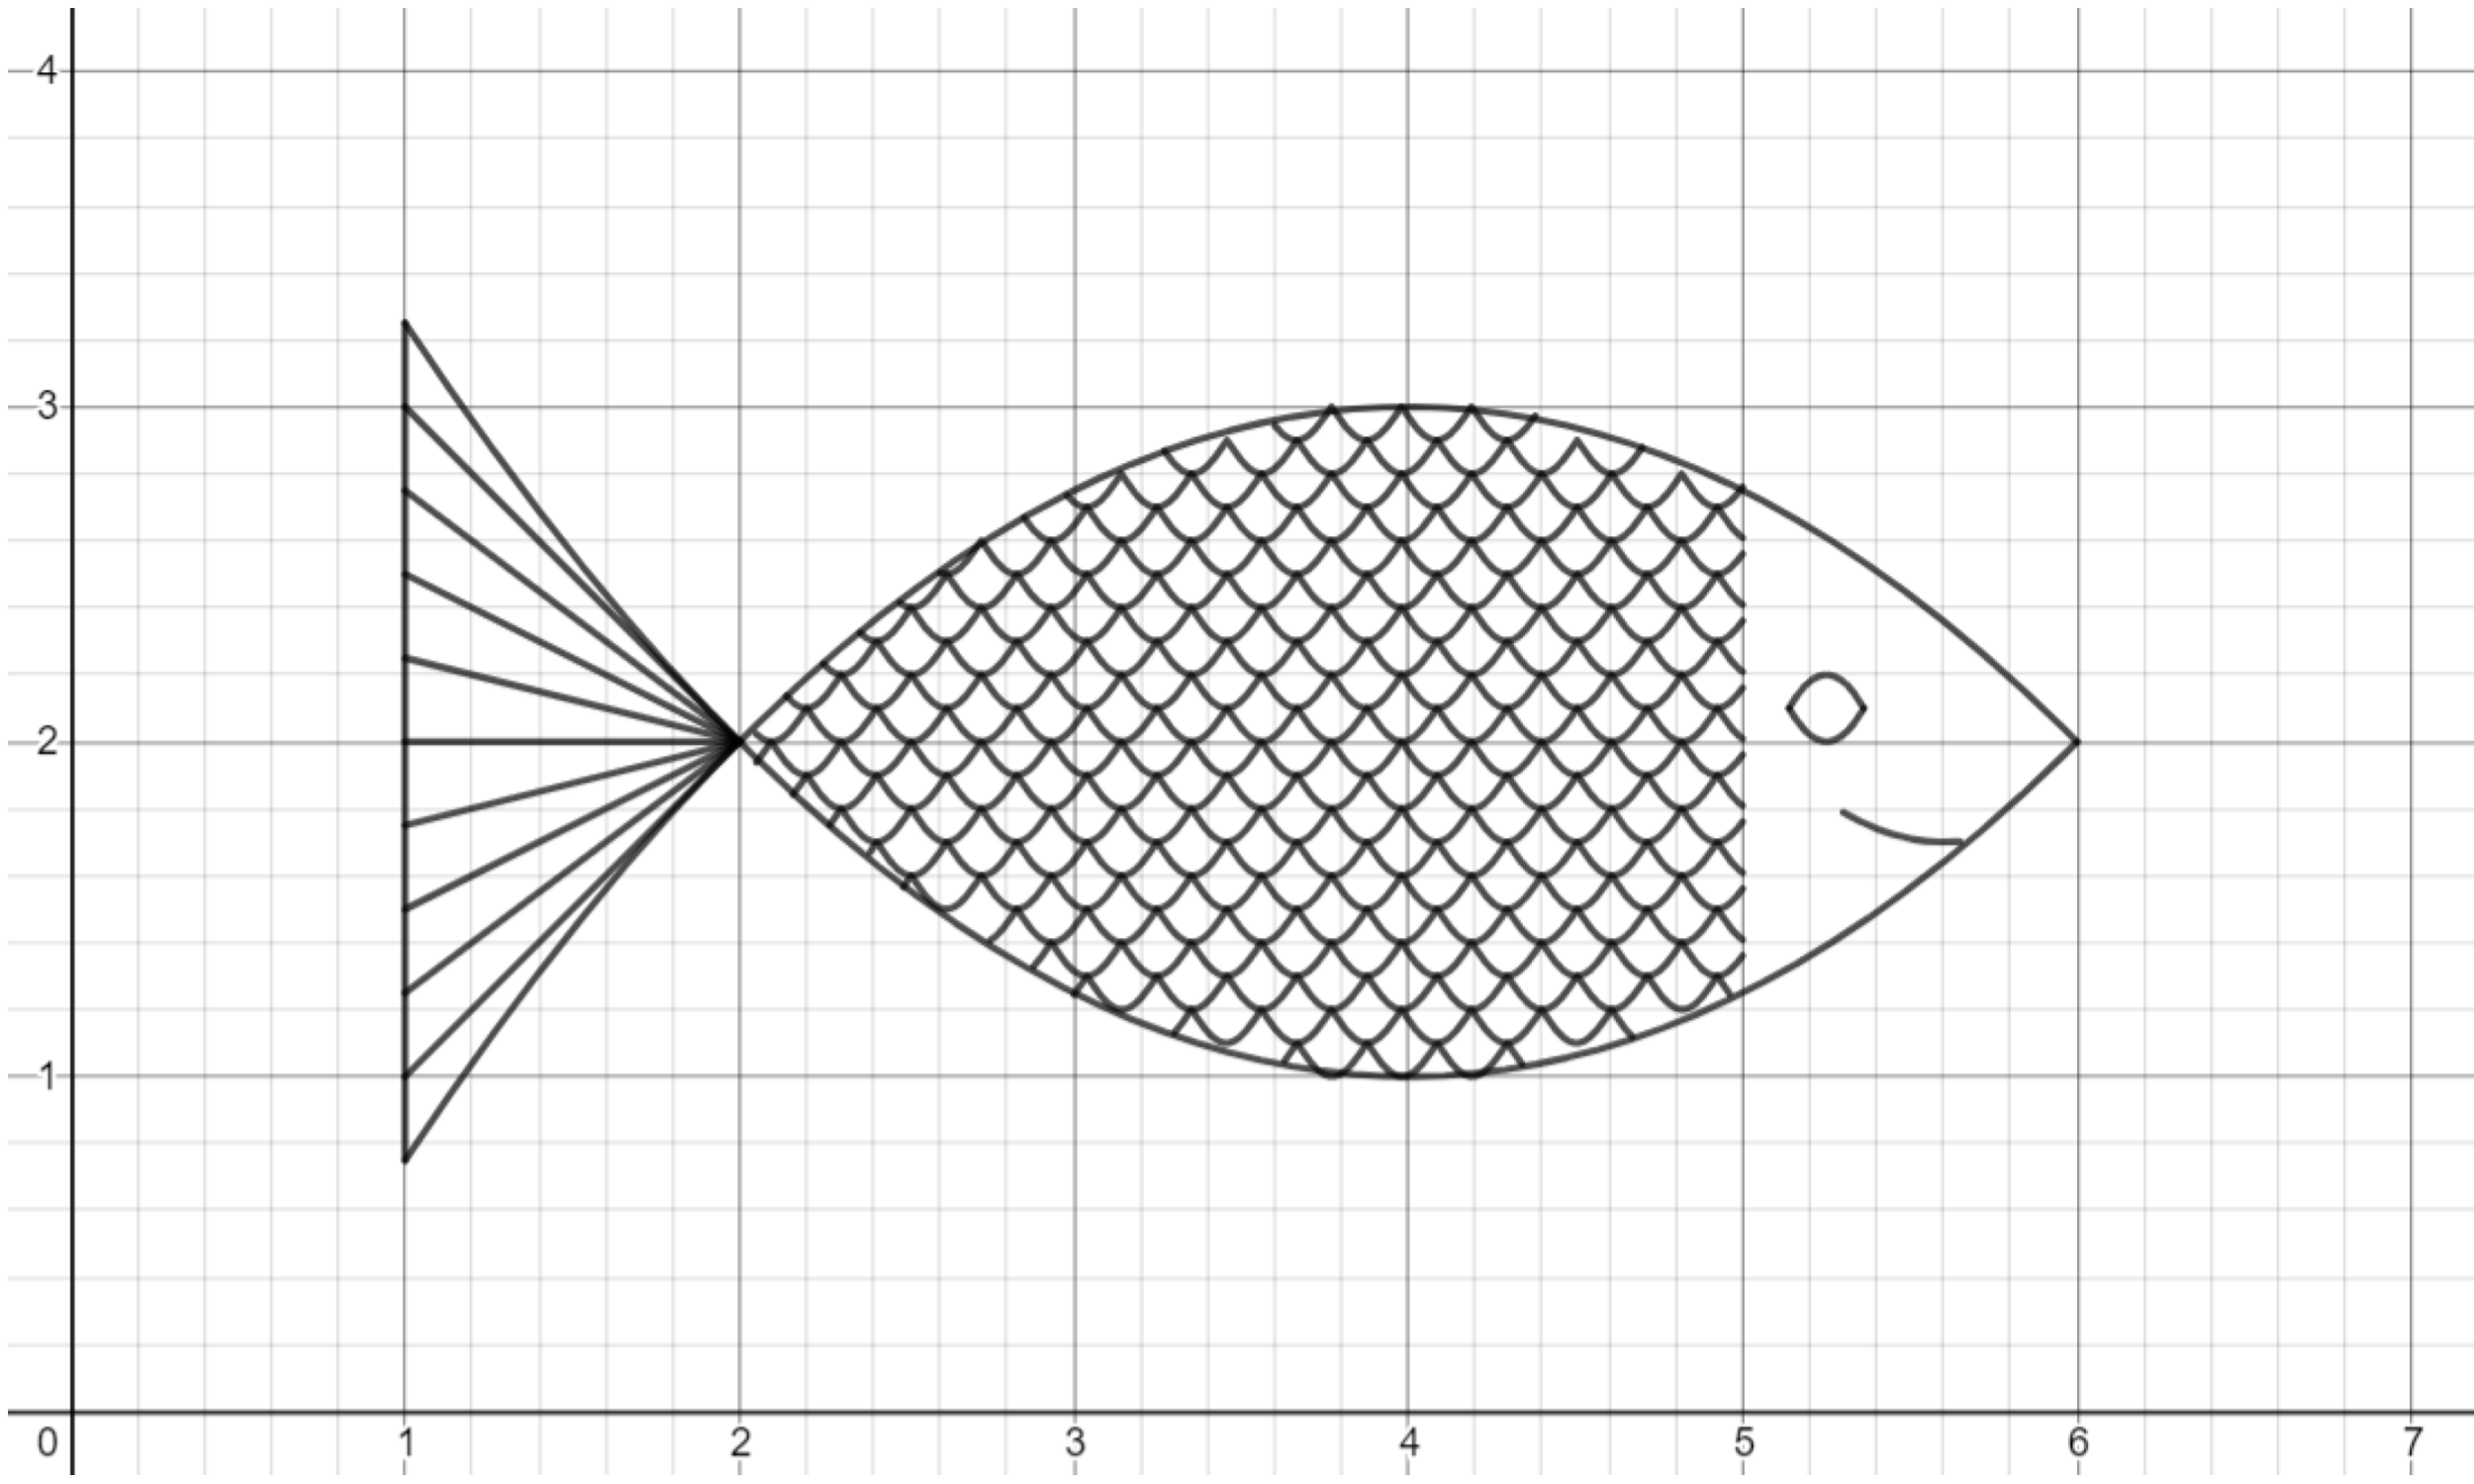
Exercise. Lastly, use lines to create spines in the tail of the fish.
Challenge. Try to draw other scaled creatures, such as a snake!
This post is part of the book Graphing Calculator Drawing Exercises. Suggested citation: Skycak, J. (2019). Graphing Calculator Drawing: Sine Waves. In Graphing Calculator Drawing Exercises. https://justinmath.com/graphing-calculator-drawing-sine-waves/
Want to get notified about new posts? Join the mailing list and follow on X/Twitter.