Graphing Calculator Drawing: Shading with Sine
High-frequency sine waves can be used to draw shaded regions.
This post is part of the book Graphing Calculator Drawing Exercises. Suggested citation: Skycak, J. (2019). Graphing Calculator Drawing: Shading with Sine. In Graphing Calculator Drawing Exercises. https://justinmath.com/graphing-calculator-drawing-shading-with-sine/
Want to get notified about new posts? Join the mailing list and follow on X/Twitter.
Setup. Navigate to https://www.desmos.com/calculator. Be sure to sign in so that you can save your graph.
Demonstration - High Frequency. Observe the graph as you type each of the following inputs. In general, the graph of $y=\sin(vx)$ looks more and more solid as $v$ increases.
Demonstration - Thickening a Curve. Observe the graph as you type each of the following inputs. In general, for large $v,$ the graph of $y=f(x)+A\sin(vx)$ thickens the curve $y=f(x)$ to have a vertical thickness of $2A.$
Demonstration - Varying Amplitude. Observe the graph as you type each of the following inputs. In general, when $v$ is large, the graph of $y=f(x)\sin(vx)$ shades the area between the graphs of $y=-f(x)$ and $y=f(x).$
Demonstration - Shifts. Observe the graph as you type each of the following inputs. In general, the graph of $y=f(x-a)\sin(vx)+b$ is the graph of $y=f(x)\sin(vx)$ shifted right by $a$ units and up by $b$ units.
Demonstration - Limitations. Observe the graph as you type each of the following inputs.
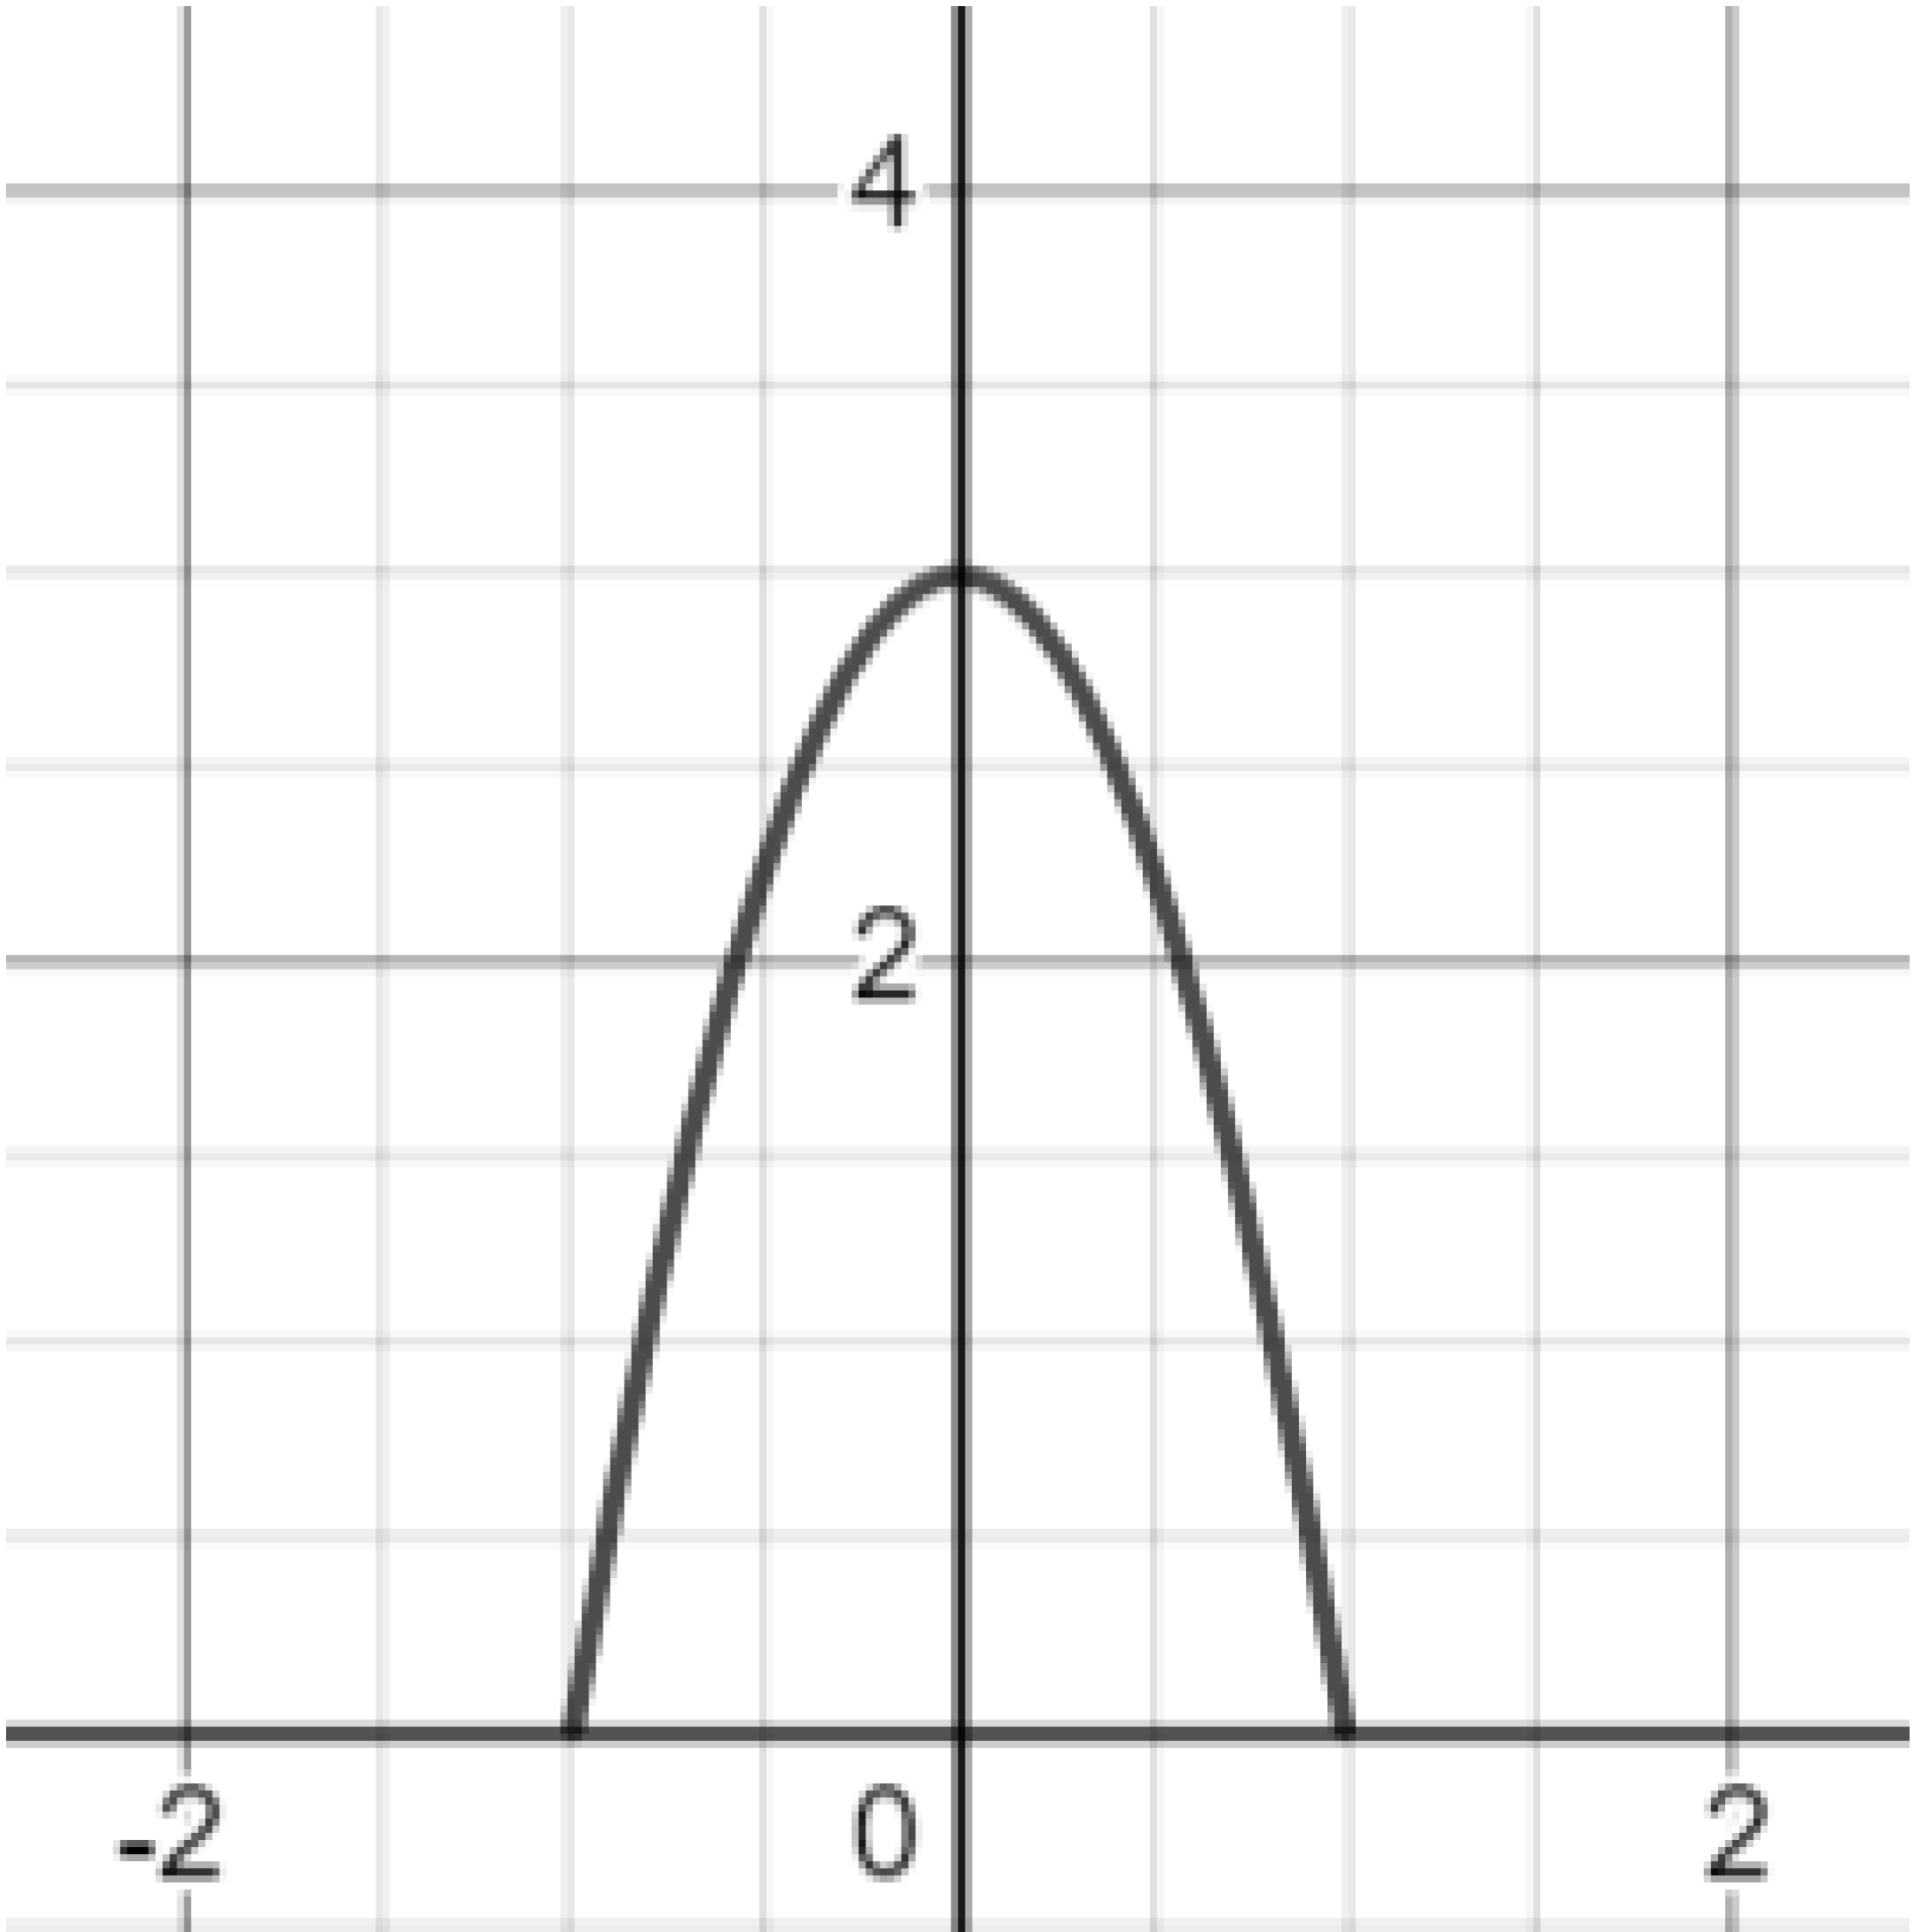
Exercise. Reproduce the downward parabola shown below.
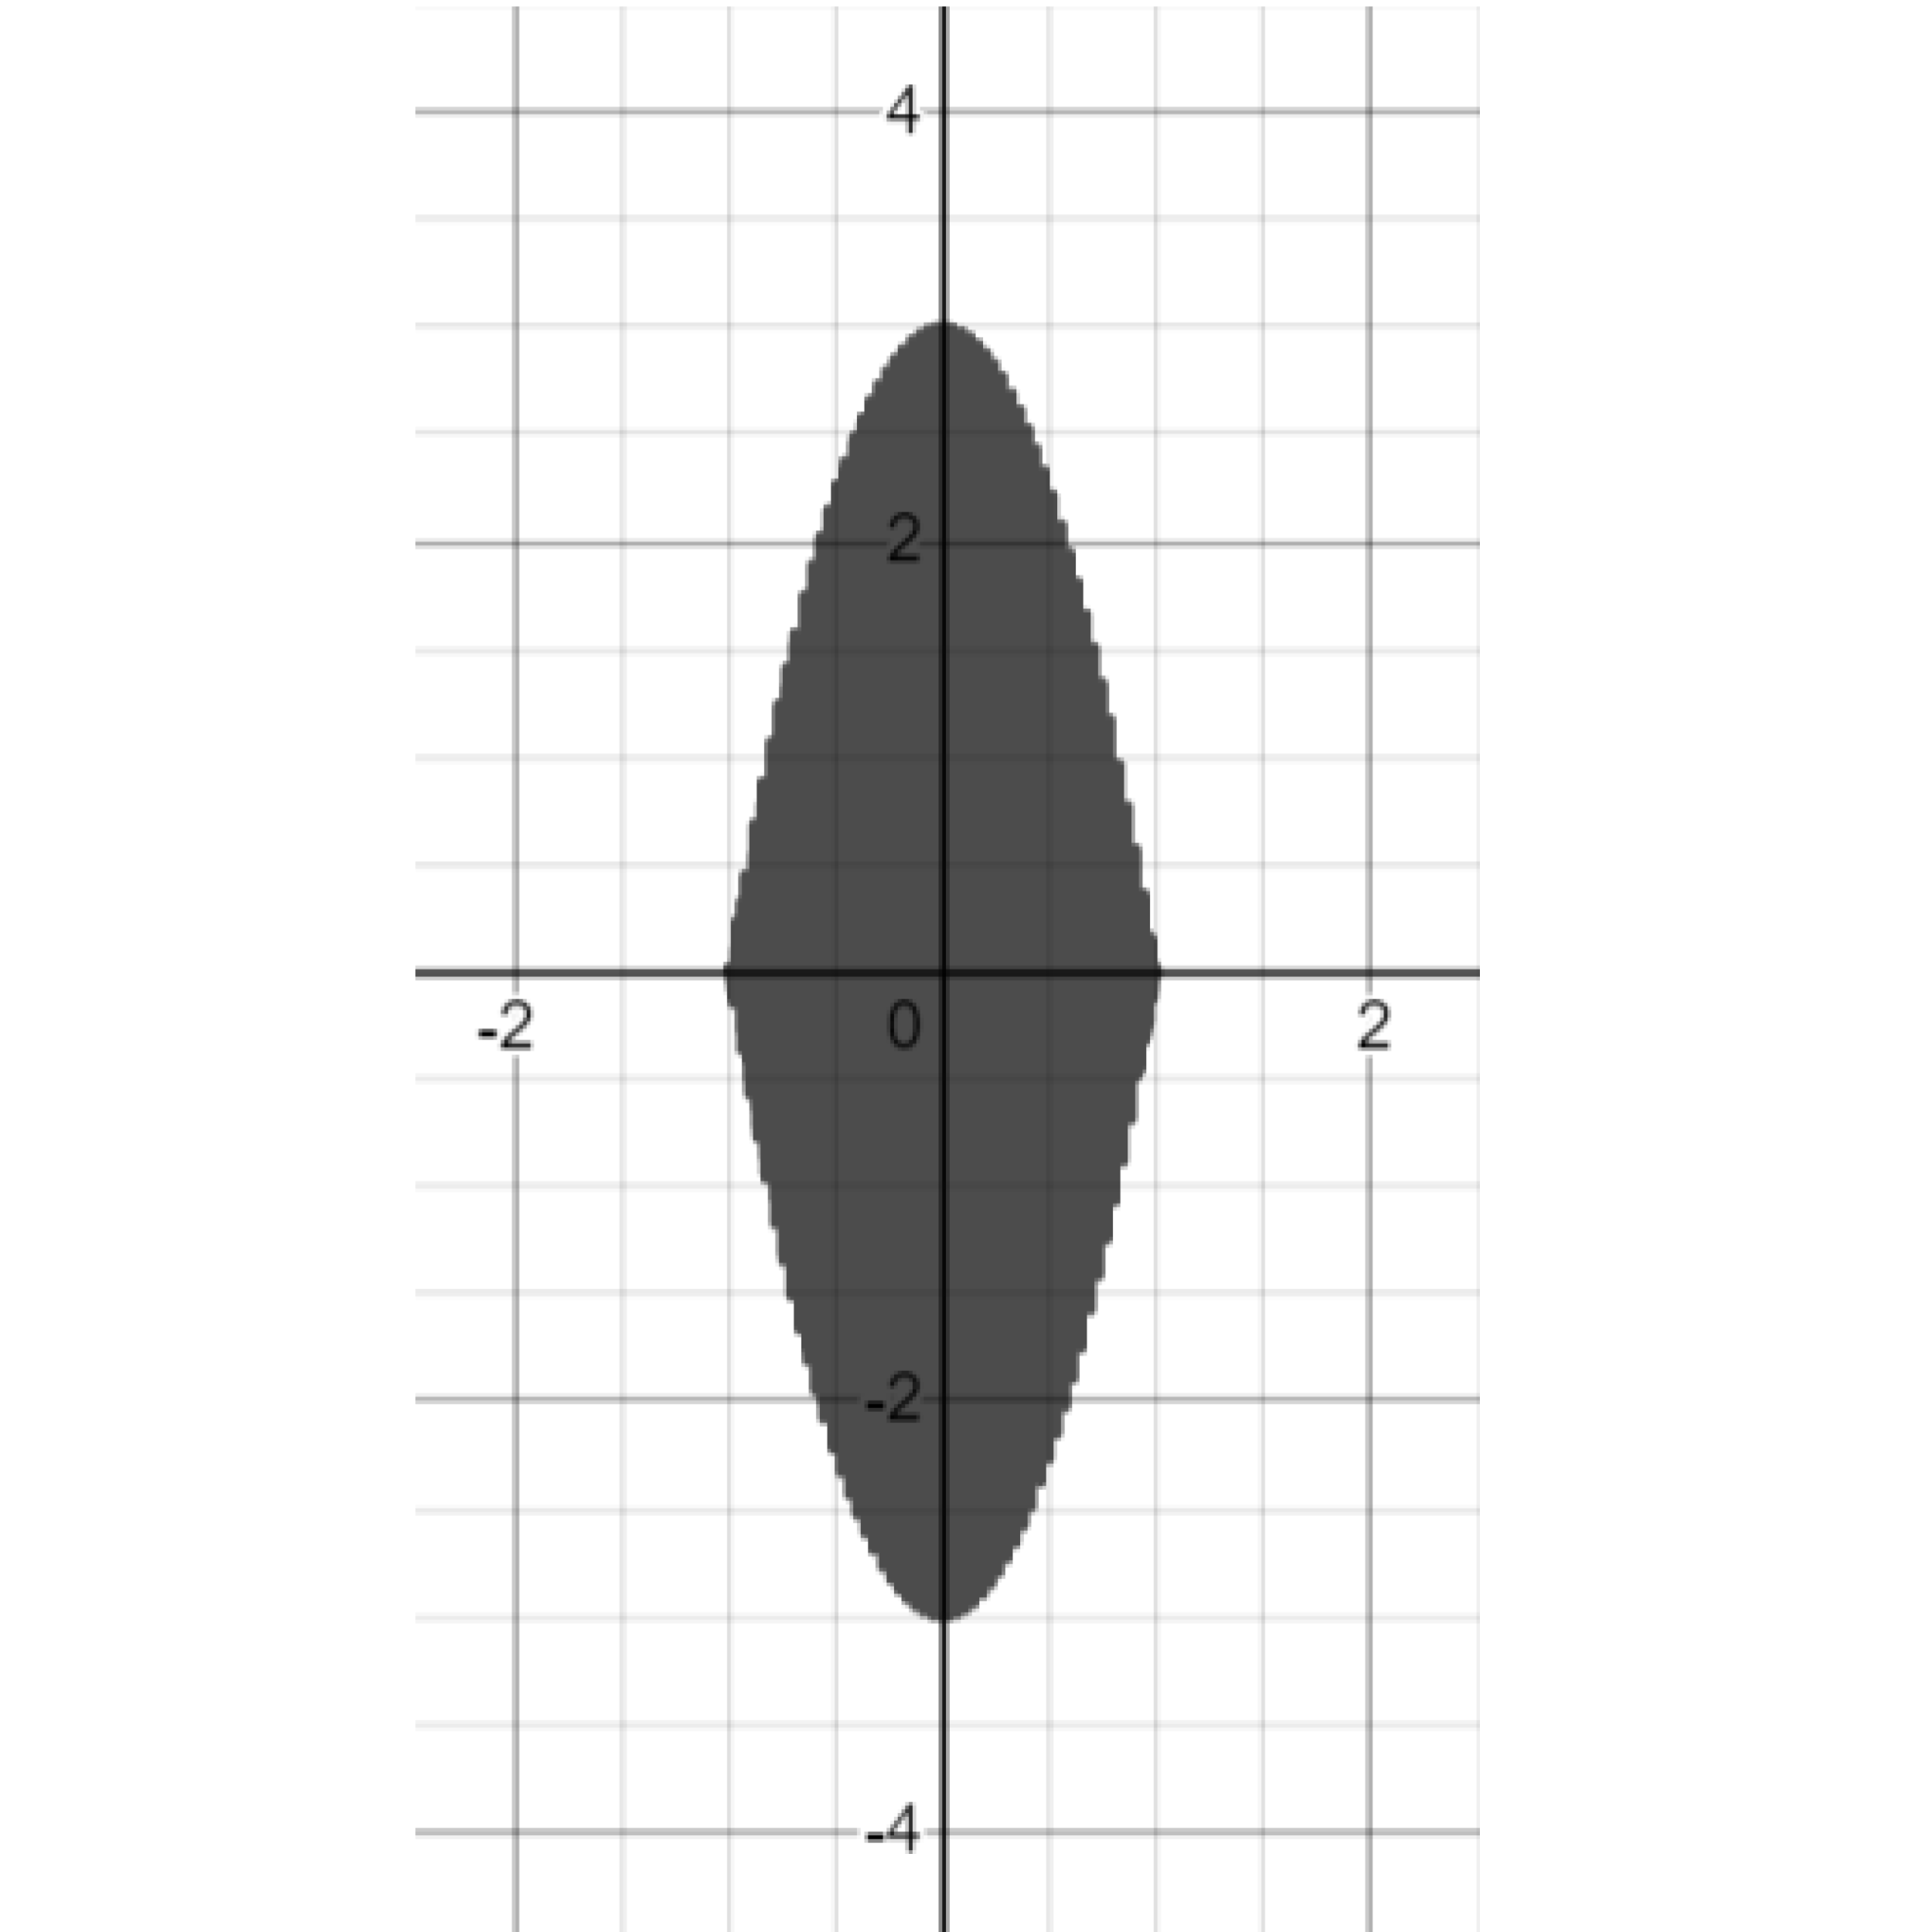
Exercise. Use the parabola as the amplitude of a high-frequency sine function to create a shaded area.
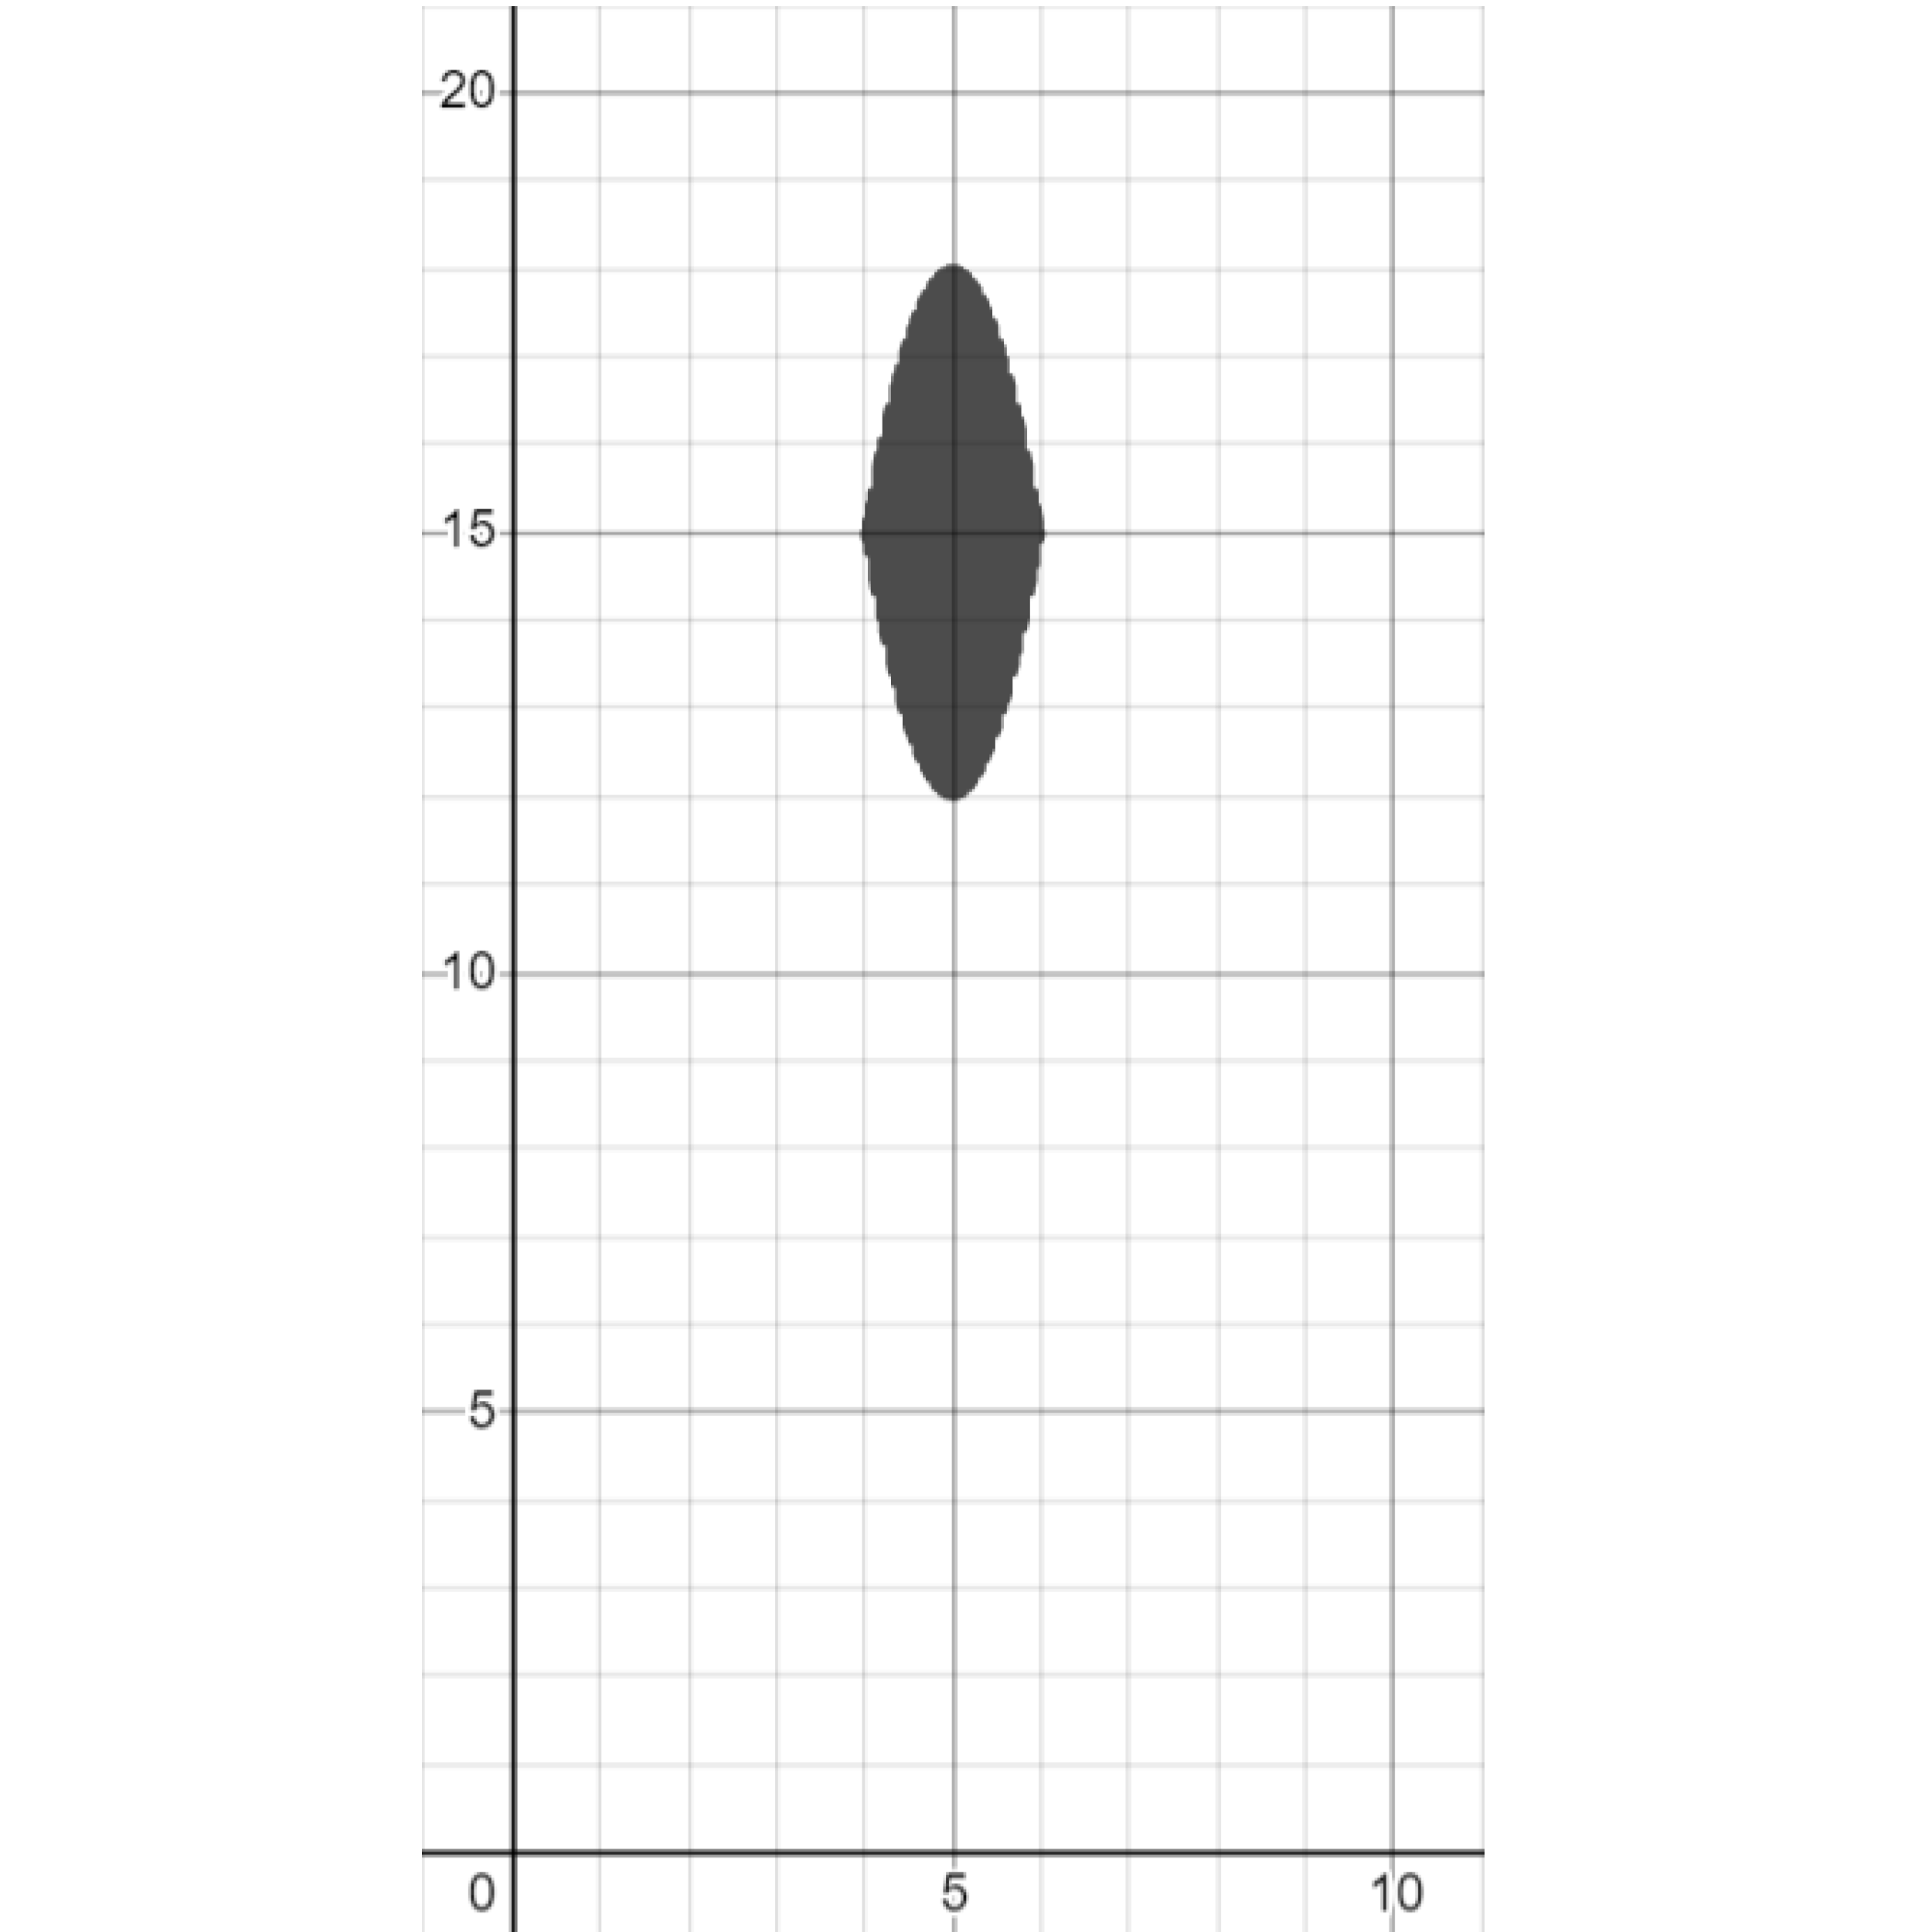
Exercise. Shift the shaded area up and right.
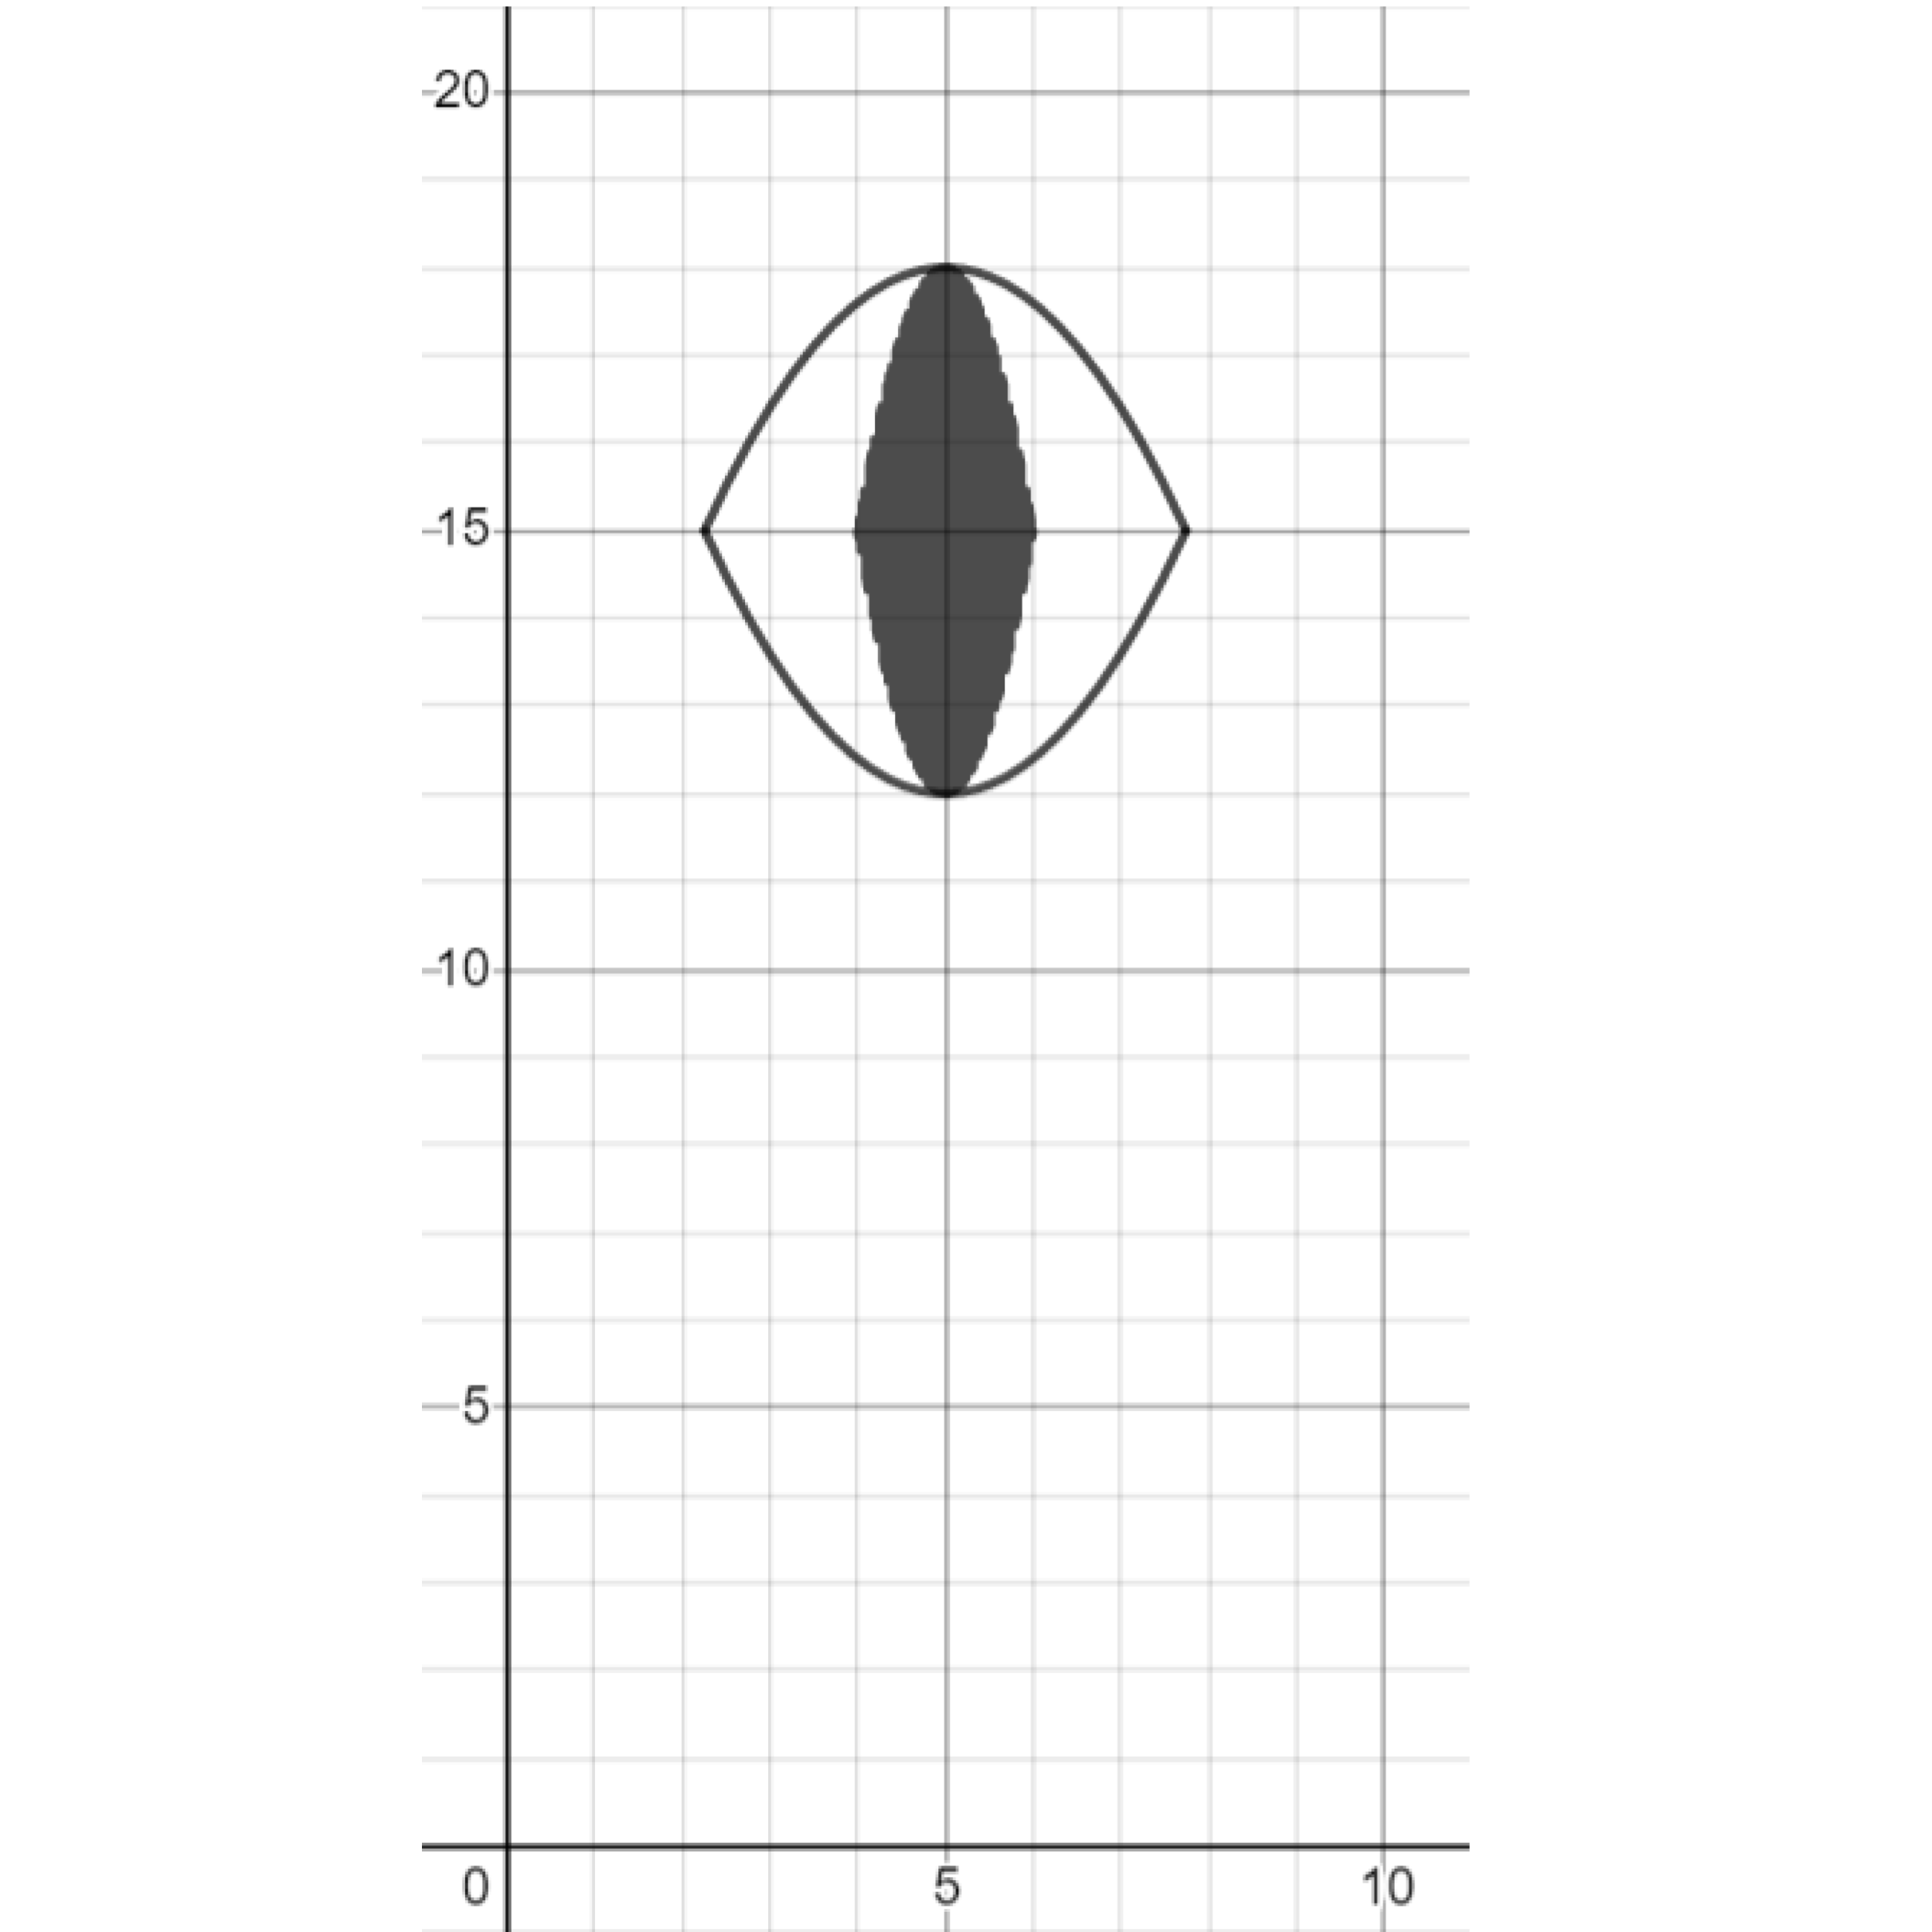
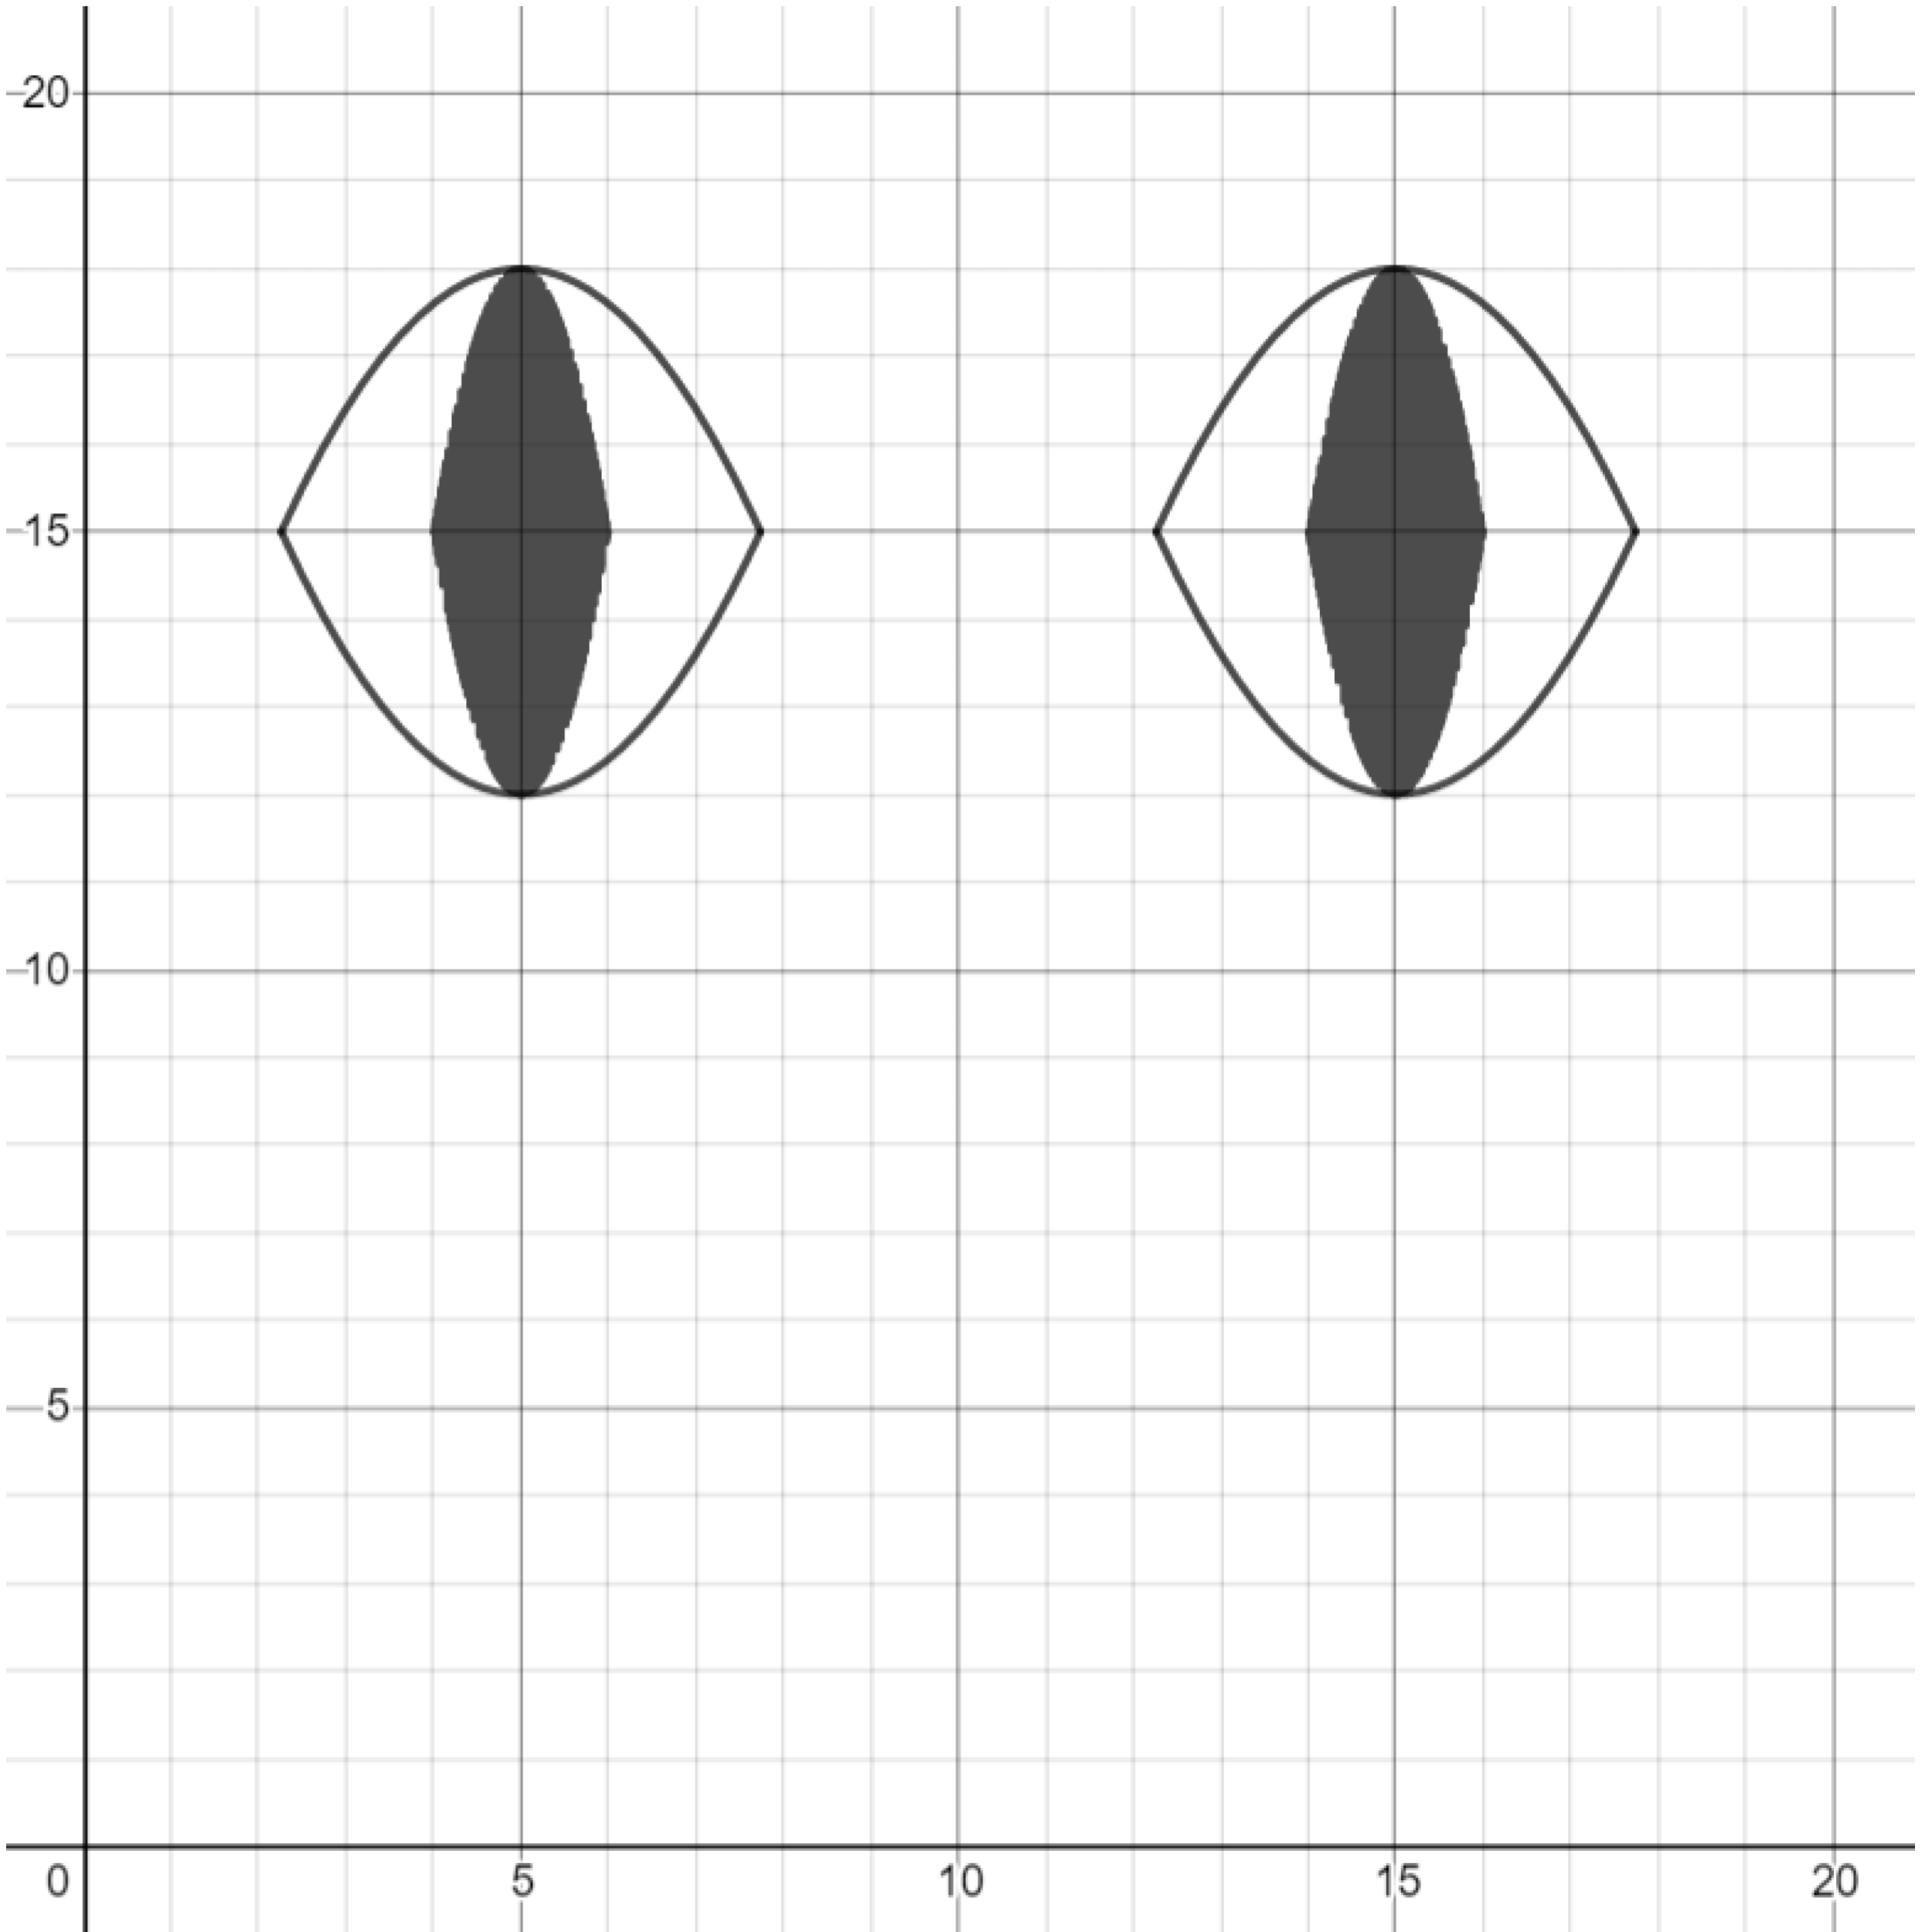
Exercise. Draw parabolas around the shaded area to create an eye.
Exercise. Create another eye.
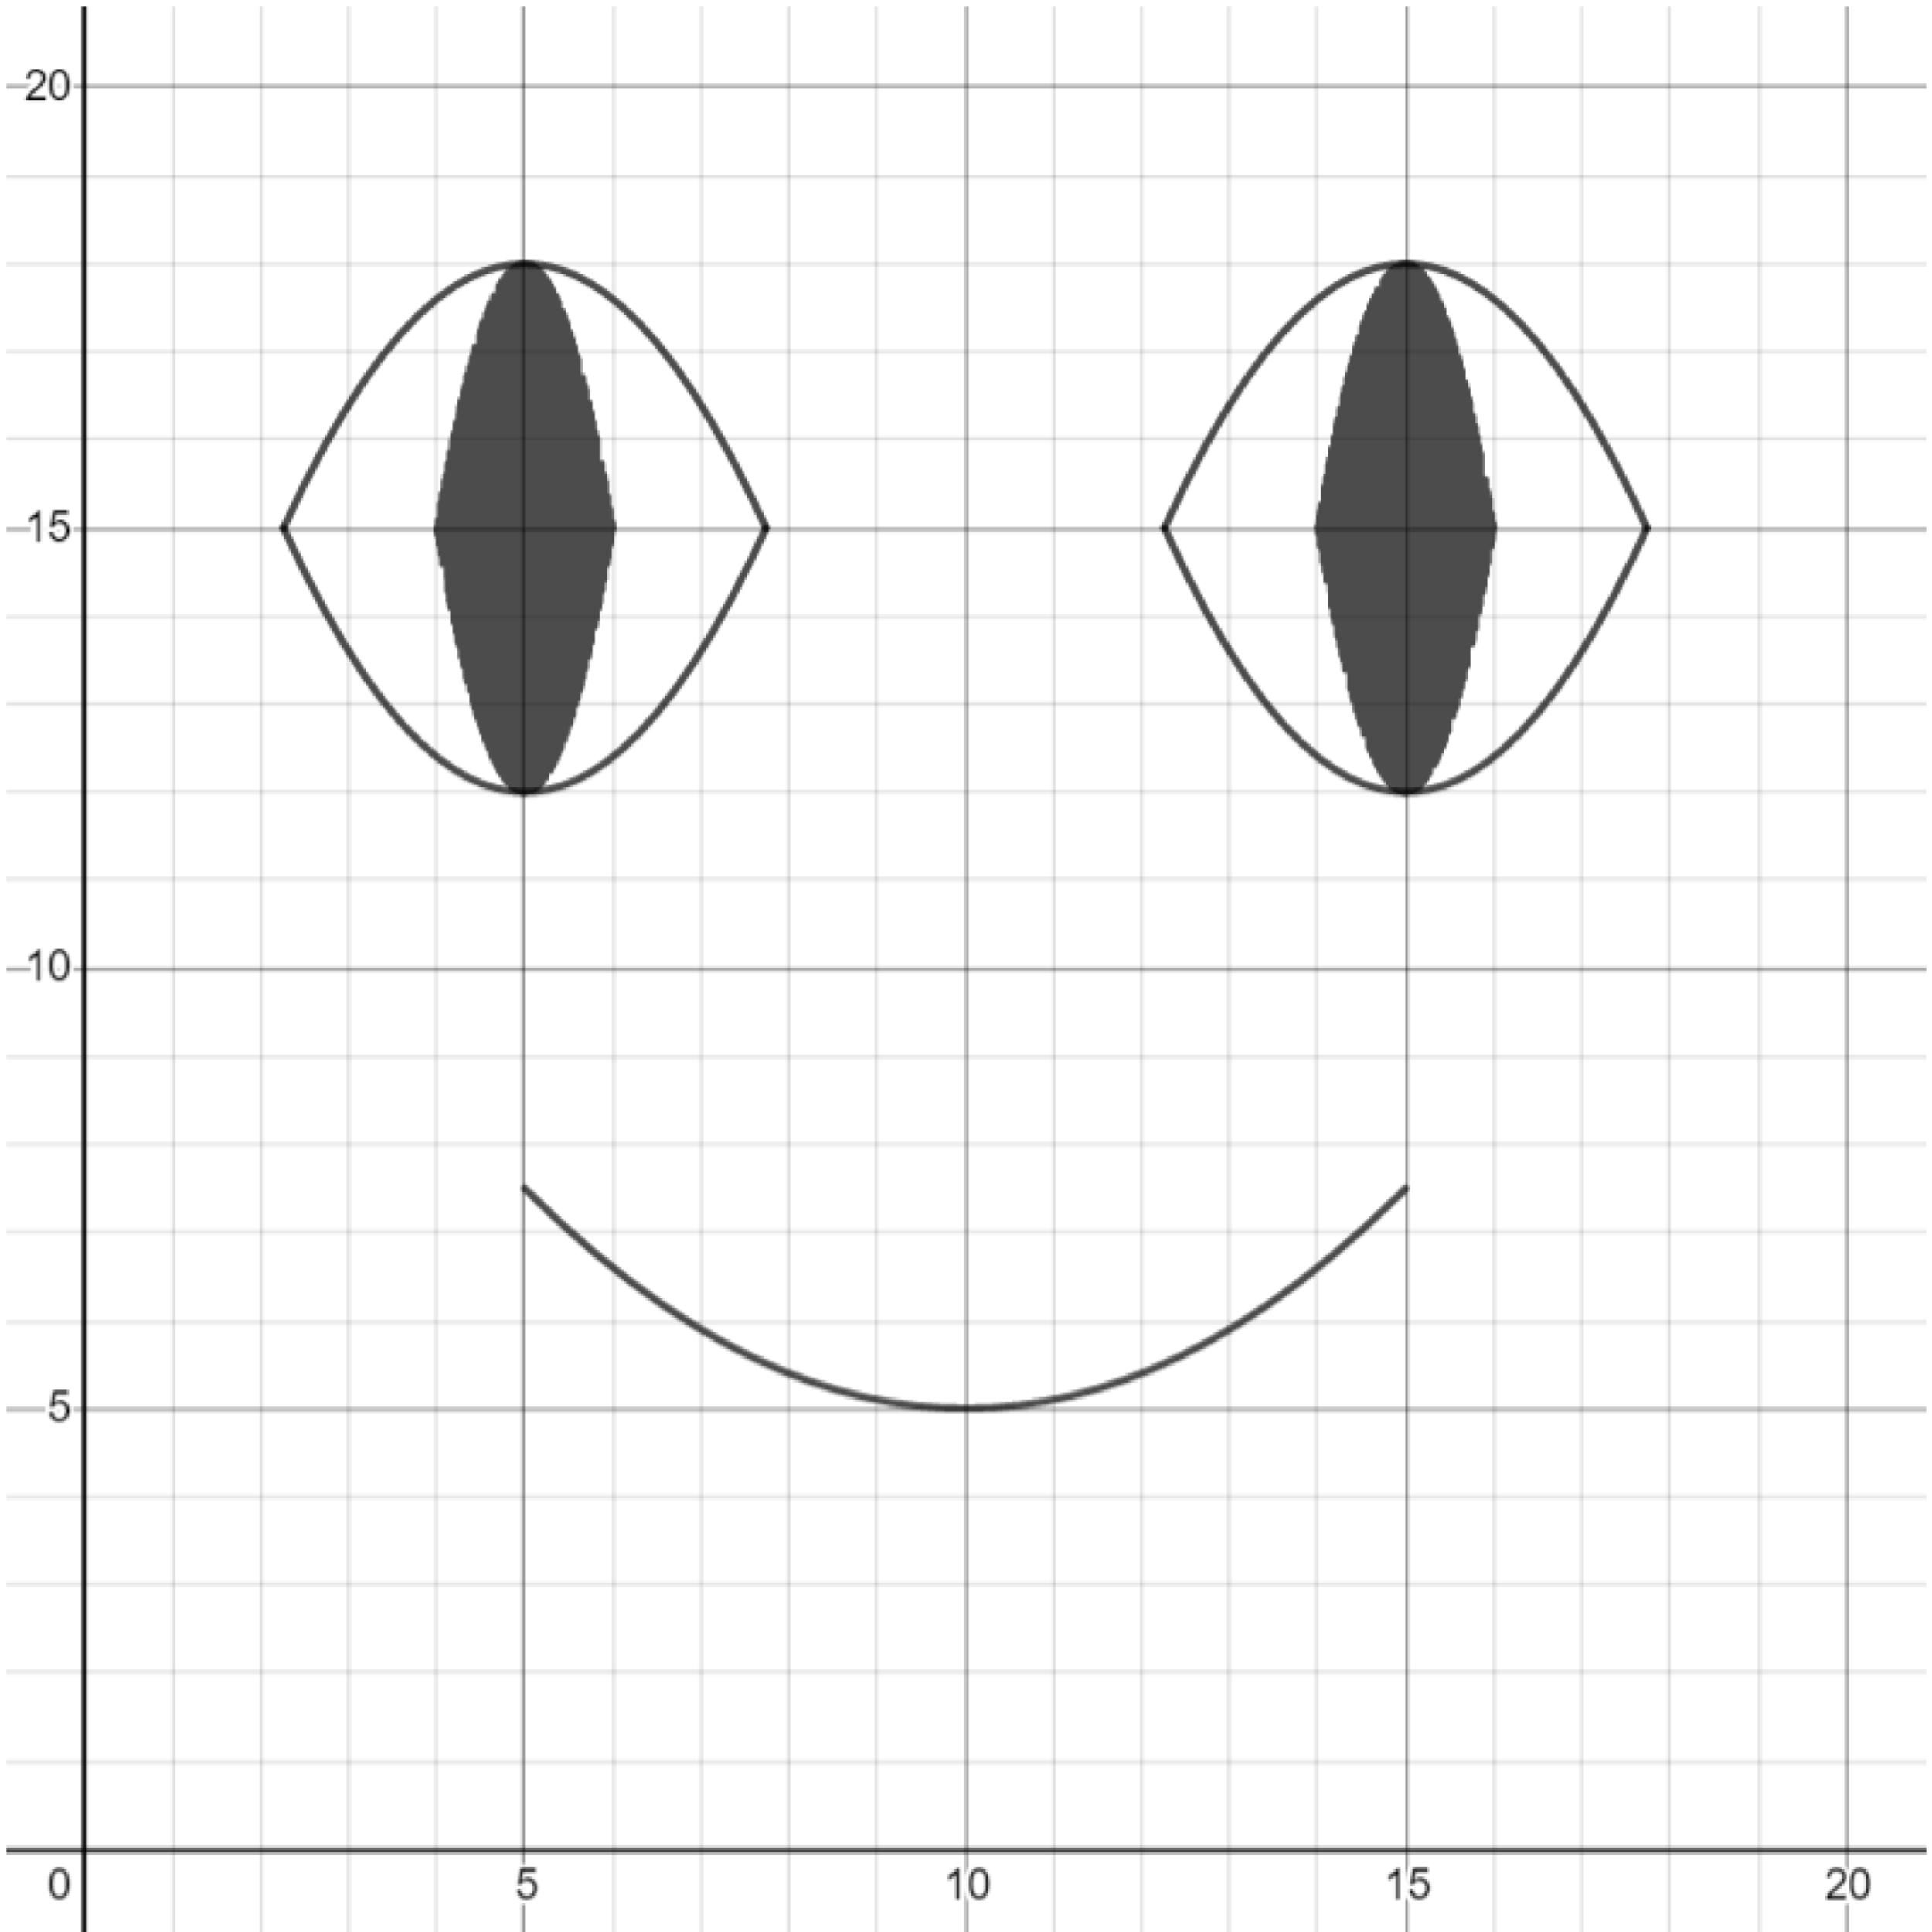
Exercise. Create a parabola in the shape of a mouth.
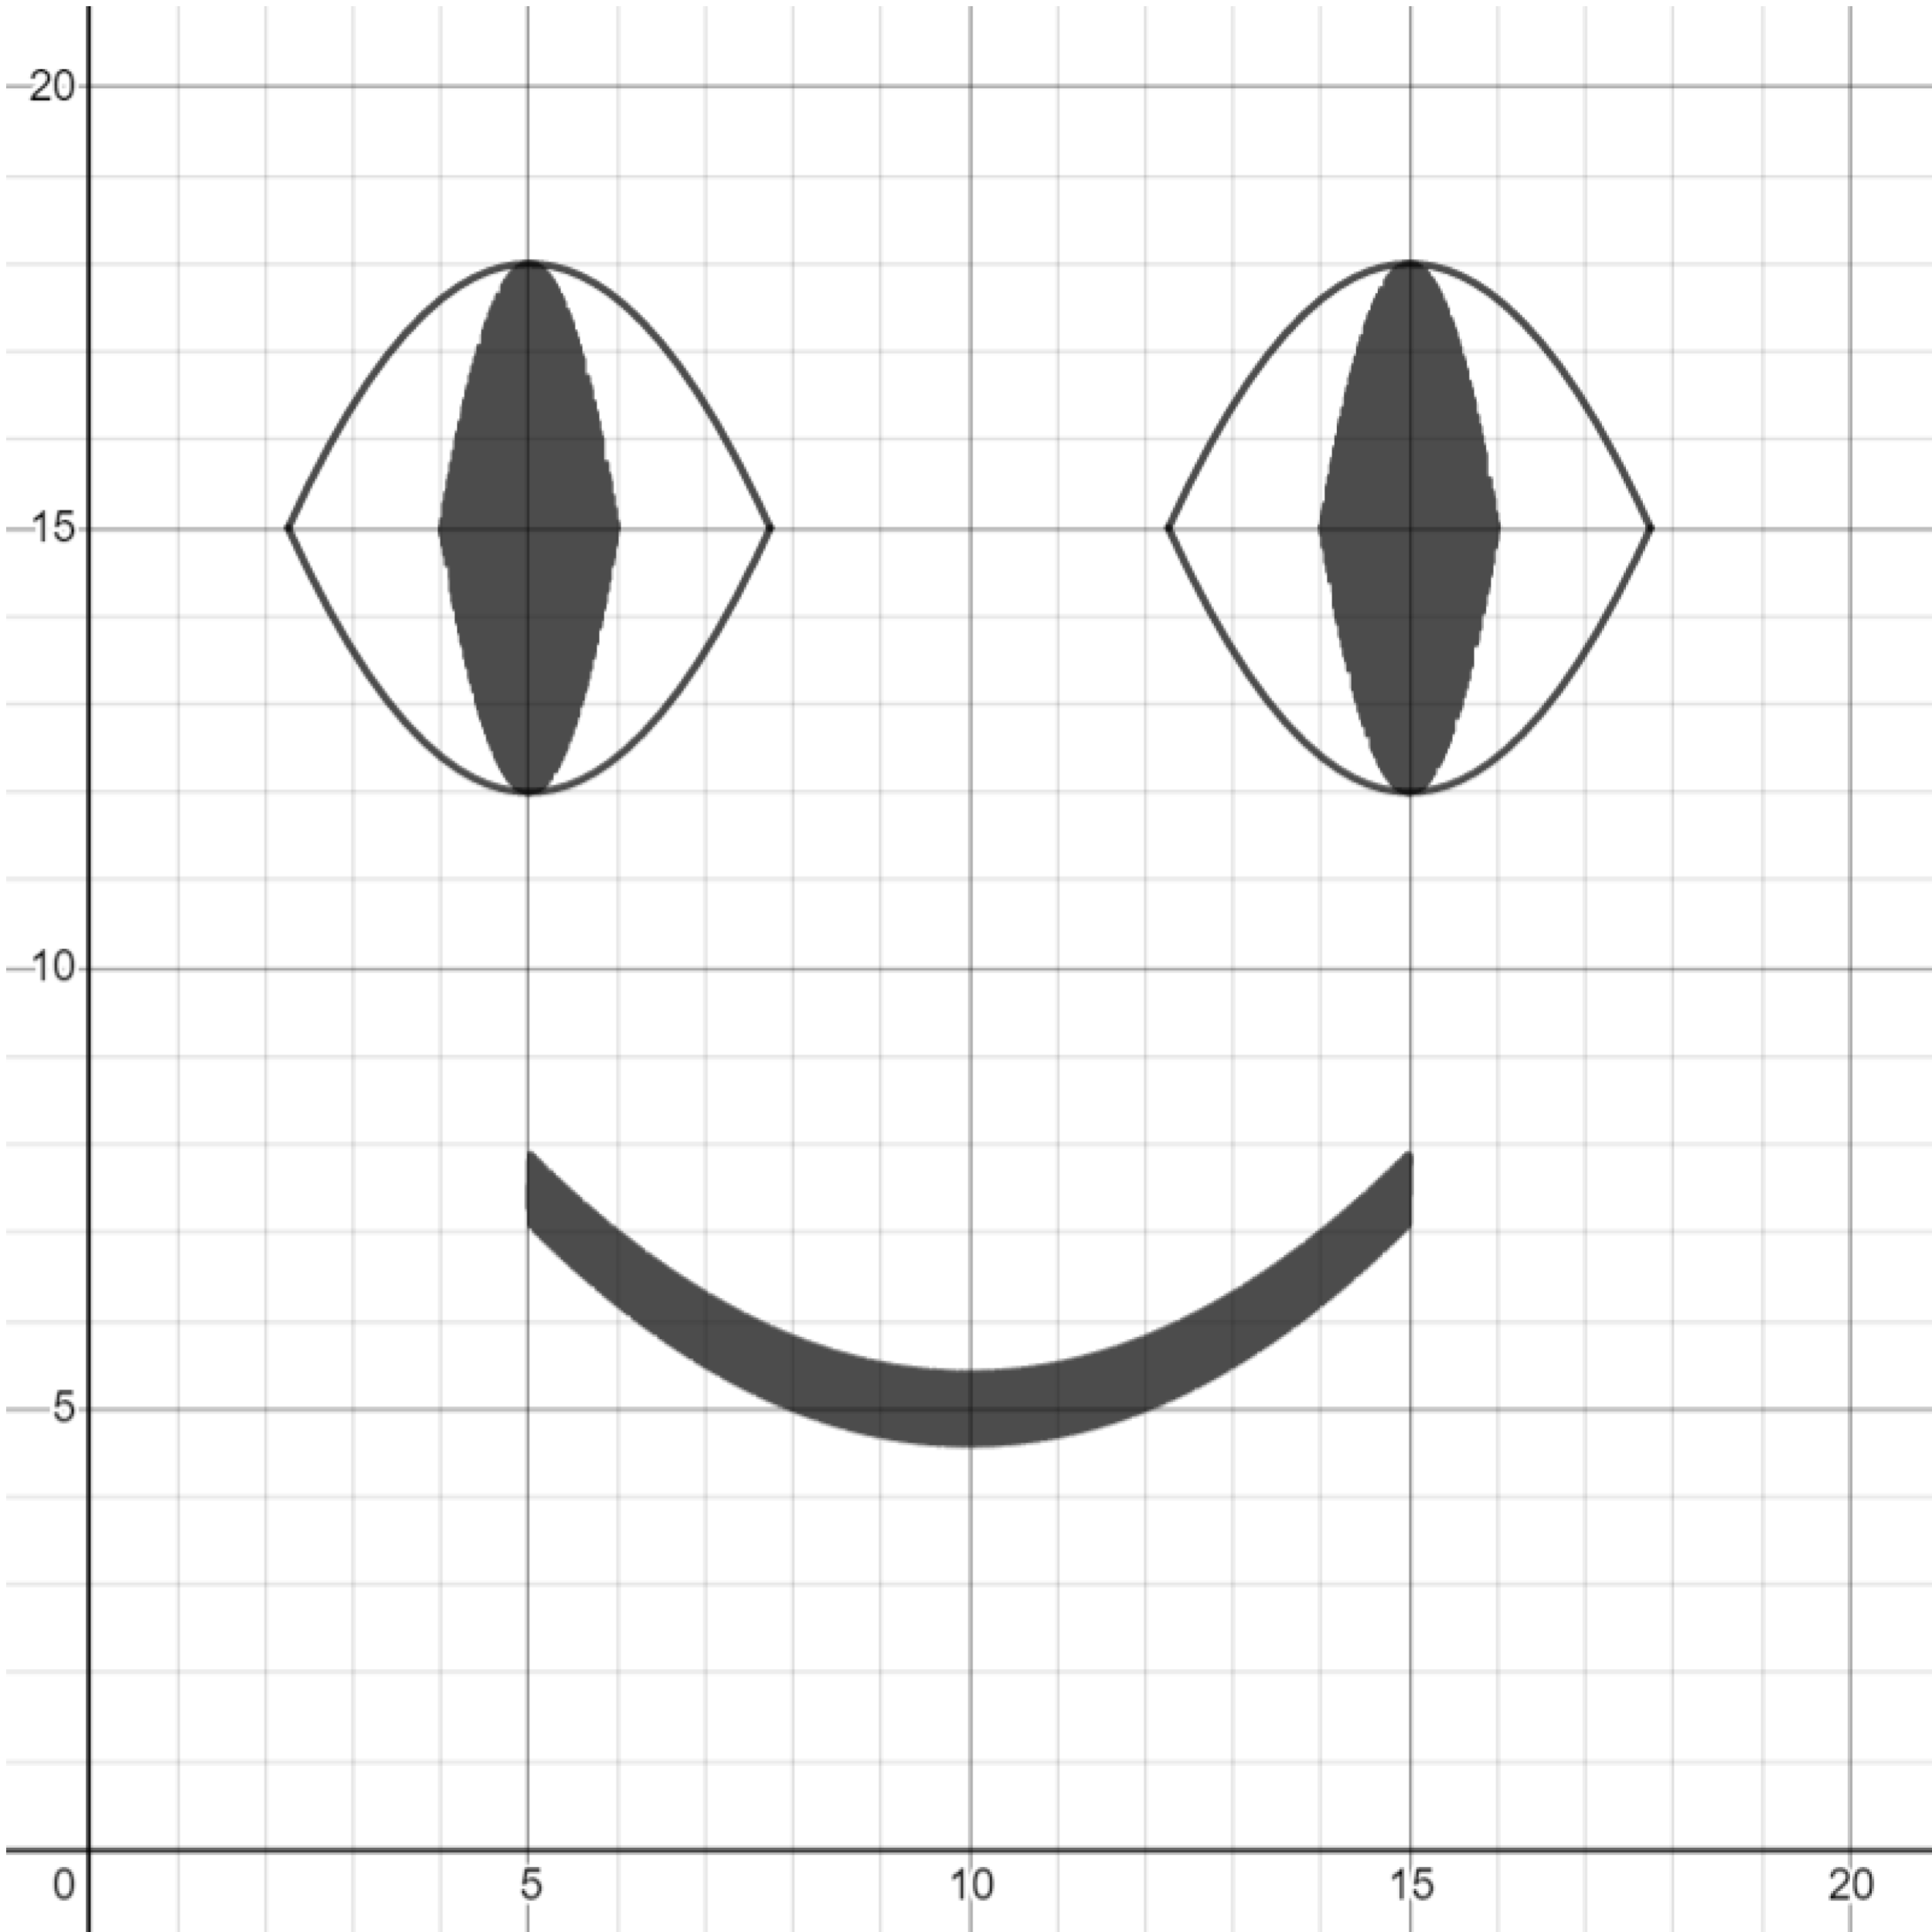
Exercise. Thicken the parabola that forms the shape of the mouth.
Challenge. Make other kinds of emoji faces, such as a sad face or a laughing face.
This post is part of the book Graphing Calculator Drawing Exercises. Suggested citation: Skycak, J. (2019). Graphing Calculator Drawing: Shading with Sine. In Graphing Calculator Drawing Exercises. https://justinmath.com/graphing-calculator-drawing-shading-with-sine/
Want to get notified about new posts? Join the mailing list and follow on X/Twitter.